Useful OpenQuake Commands#
The oq command-line script is the entry point for several commands, the most important one being oq engine, which is the recommended way for using the engine thorught the manual.
The commands documented here are consider experimental (some may disappear, others are meant for debugging). Still, some of them are quite stable and quite useful for the end-users. Here we document only the commands that are useful for the general public and have reached some level of stability.
You can see the full list of commands by running oq –help:
$ oq --help
usage: oq [-h] [-v]
          {shell,upgrade_nrml,reduce_smlt,show_attrs,prepare_site_model,nrml_from,shakemap2gmfs,importcalc,run,show,purge,renumber_sm,workers,postzip,plot_assets,db,dbserver,tidy,extract,sample,to_hdf5,ltcsv,reaggregate,restore,mosaic,check_input,dump,info,zip,abort,nrml_to,engine,reset,checksum,export,webui,compare,plot,reduce_sm}
          ...

positional arguments:
  {shell,upgrade_nrml,reduce_smlt,show_attrs,prepare_site_model,nrml_from,shakemap2gmfs,importcalc,run,show,purge,renumber_sm,workers,postzip,plot_assets,db,dbserver,tidy,extract,sample,to_hdf5,ltcsv,reaggregate,restore,mosaic,check_input,dump,info,zip,abort,nrml_to,engine,reset,checksum,export,webui,compare,plot,reduce_sm}
                        available subcommands; use oq <subcmd> --help

options:
  -h, --help            show this help message and exit
  -v, --version         show program's version number and exit
This output may change depending on the engine version. There are several commands, like purge, show_attrs, export, restore, … You can get information about each command with oq <command> –help; for instance, here is the help for purge:
$ oq purge --help
usage: oq purge [-h] [-f] calc_id

Remove the given calculation. If you want to remove all calculations, use oq
reset.

positional arguments:
  calc_id      calculation ID

optional arguments:
  -h, --help   show this help message and exit
  -f, --force  ignore dependent calculations
oq info#
Probably the most important command. oq info has several features.
It can be invoked to provide global information about the engine and its libraries. Try, for instance:
$ oq info calculators # list available calculators
$ oq info gsims       # list available GSIMs
$ oq info views       # list available views
$ oq info exports     # list available exports
$ oq info parameters  # list all job.ini parameters
It can be invoked with a job.ini file to extract information about the logic tree of the calculation.
When invoked with the –report option, it produces a .rst report with important information about the computation. It is ESSENTIAL in the case of large calculations, since it will give you an idea of the feasibility of the computation without running it. Here is an example of usage:
$ oq info --report job.ini
Generated /tmp/report_1644.rst
<Monitor info, duration=10.910529613494873s, memory=60.16 MB>
You can open /tmp/report_1644.rst and read the information listed there (1644 is the calculation ID, the number will be different each time).
oq export#
The second most important command is oq export. It allows customization of the exports from the datastore with additional flexibility compared to the oq engine export commands. In the future the oq engine exports commands might be deprecated and oq export might become the official export command, but we are not there yet.
Here is the usage message:
$ oq export --help
usage: oq export [-h] [-e csv] [-d .] datastore_key [calc_id]

Export an output from the datastore.

positional arguments:
  datastore_key         datastore key
  calc_id               number of the calculation [default: -1]

optional arguments:
  -h, --help            show this help message and exit
  -e csv, --exports csv
                      export formats (comma separated)
  -d ., --export-dir .  export directory
The list of available exports (i.e. the datastore keys and the available export formats) can be extracted with the oq info exports command; the number of exporters defined changes at each version:
$ oq info exports
? "aggregate_by" ['csv']
? "disagg_traditional" ['csv']
? "loss_curves" ['csv']
? "losses_by_asset" ['npz']
Aggregate Asset Losses "agglosses" ['csv']
Aggregate Loss Curves Statistics "agg_curves-stats" ['csv']
Aggregate Losses "aggrisk" ['csv']
Aggregate Risk Curves "aggcurves" ['csv']
Aggregated Risk By Event "risk_by_event" ['csv']
Asset Loss Curves "loss_curves-rlzs" ['csv']
Asset Loss Curves Statistics "loss_curves-stats" ['csv']
Asset Loss Maps "loss_maps-rlzs" ['csv', 'npz']
Asset Loss Maps Statistics "loss_maps-stats" ['csv', 'npz']
Asset Risk Distributions "damages-rlzs" ['npz', 'csv']
Asset Risk Statistics "damages-stats" ['csv']
Average Asset Losses "avg_losses-rlzs" ['csv']
Average Asset Losses Statistics "avg_losses-stats" ['csv']
Average Ground Motion Field "avg_gmf" ['csv']
Benefit Cost Ratios "bcr-rlzs" ['csv']
Benefit Cost Ratios Statistics "bcr-stats" ['csv']
Disaggregation Outputs "disagg" ['csv']
Earthquake Ruptures "ruptures" ['csv']
Events "events" ['csv']
Exposure + Risk "asset_risk" ['csv']
Full Report "fullreport" ['rst']
Ground Motion Fields "gmf_data" ['csv', 'hdf5']
Hazard Curves "hcurves" ['csv', 'xml', 'npz']
Hazard Maps "hmaps" ['csv', 'xml', 'npz']
Input Files "input" ['zip']
Mean Conditional Spectra "cs-stats" ['csv']
Realizations "realizations" ['csv']
Source Loss Table "src_loss_table" ['csv']
Total Risk "agg_risk" ['csv']
Uniform Hazard Spectra "uhs" ['csv', 'xml', 'npz']
There are 44 exporters defined.
At the present the supported export types are xml, csv, rst, npz and hdf5. xml has been deprecated for some outputs and is not the recommended format for large exports. For large exports, the recommended formats are npz (which is a binary format for numpy arrays) and hdf5. If you want the data for a specific realization (say the first one), you can use:
$ oq export hcurves/rlz-0 --exports csv
$ oq export hmaps/rlz-0 --exports csv
$ oq export uhs/rlz-0 --exports csv
but currently this only works for csv and xml. The exporters are one of the most time-consuming parts on the engine, mostly because of the sheer number of them; there are more than fifty exporters and they are always increasing. If you need new exports, please add an issue on GitHub.
oq zip#
An extremely useful command if you need to copy the files associated to a computation from a machine to another is oq zip:
$ oq zip --help
usage: oq zip [-h] [-r] what [archive_zip]

positional arguments:
  what               path to a job.ini, a ssmLT.xml file, or an exposure.xml
  archive_zip        path to a non-existing .zip file [default: '']

optional arguments:
  -h, --help         show this help message and exit
  -r , --risk-file   optional file for risk
For instance, if you have two configuration files job_hazard.ini and job_risk.ini, you can zip all the files they refer to with the command:
$ oq zip job_hazard.ini -r job_risk.ini
oq zip is actually more powerful than that; other than job.ini files, it can also zip source models:
$ oq zip ssmLT.xml
and exposures:
$ oq zip my_exposure.xml
Importing a remote calculation#
The use-case is importing on your laptop a calculation that was executed on a remote server/cluster. For that to work
you need to create a file a file called openquake.cfg in the virtualenv of the engine (the output of the command
oq info venv, normally it is in $HOME/openquake) with the following section:
[webapi]
server = https://oq1.wilson.openquake.org/  # change this
username = michele  # change this
password = PWD # change this
Then you can import any calculation by simply giving its ID, as in this example:
$ oq importcalc 41214
INFO:root:POST https://oq2.wilson.openquake.org//accounts/ajax_login/
INFO:root:GET https://oq2.wilson.openquake.org//v1/calc/41214/extract/oqparam
INFO:root:Saving /home/michele/oqdata/calc_41214.hdf5
Downloaded 58,118,085 bytes
{'checksum32': 1949258781,
 'date': '2021-03-18T15:25:11',
 'engine_version': '3.12.0-gita399903317'}
INFO:root:Imported calculation 41214 successfully
oq prepare_site_model#
The command oq prepare_site_model, introduced in engine 3.3, is quite useful if you have a vs30 file with fields lon, lat, vs30 and you want to generate a site model from it. Normally this feature is used for risk calculations: given an exposure, one wants to generate a collection of hazard sites covering the exposure and with vs30 values extracted from the vs30 file with a nearest neighbour algorithm:
$ oq prepare_site_model -h
usage: oq prepare_site_model [-h] [-1] [-2] [-3]
                             [-e [EXPOSURE_XML [EXPOSURE_XML ...]]]
                             [-s SITES_CSV] [-g 0] [-a 5] [-o site_model.csv]
                             vs30_csv [vs30_csv ...]

Prepare a site_model.csv file from exposure xml files/site csv files, vs30 csv
files and a grid spacing which can be 0 (meaning no grid). For each site the
closest vs30 parameter is used. The command can also generate (on demand) the
additional fields z1pt0, z2pt5 and vs30measured which may be needed by your
hazard model, depending on the required GSIMs.

positional arguments:
  vs30_csv              files with lon,lat,vs30 and no header

optional arguments:
  -h, --help            show this help message and exit
  -1, --z1pt0
  -2, --z2pt5           build the z2pt5
  -3, --vs30measured    build the vs30measured
  -e [EXPOSURE_XML [EXPOSURE_XML ...]], --exposure-xml [EXPOSURE_XML [EXPOSURE_XML ...]]
                        exposure(s) in XML format
  -s SITES_CSV, --sites-csv SITES_CSV
  -g 0, --grid-spacing 0
                        grid spacing in km (the default 0 means no grid)
  -a 5, --assoc-distance 5
                        sites over this distance are discarded
  -o site_model.csv, --output site_model.csv
                        output file
The command works in two modes: with non-gridded exposures (the default) and with gridded exposures. In the first case the unique locations of the assets are identified, and for each location the vs30 coming from the closest vs30 record is taken. In the second case, when a grid_spacing parameter is passed, a grid containing all of the exposure is built and the points with assets are associated to the vs30 records. In both cases if the closest vs30 record is over the site_param_distance - which by default is 5 km - a warning is printed.
In large risk calculations, it is quite preferable to use the gridded mode because with a well spaced grid,
the results are nearly the same than without the grid and
the calculation is a lot faster and uses a lot less memory.
Gridding of the exposure makes large calculations more manageable. The command is able to manage multiple Vs30 files at once. Here is an example of usage:
$ oq prepare_site_model Vs30/Ecuador.csv Vs30/Bolivia.csv -e Exposure/Exposure_Res_Ecuador.csv Exposure/Exposure_Res_Bolivia.csv --grid-spacing=10
Example of a site model using a reduced exposure model
The image below presents an example for Colombia using the USGS vs30 database and a simplified exposure model with 10.
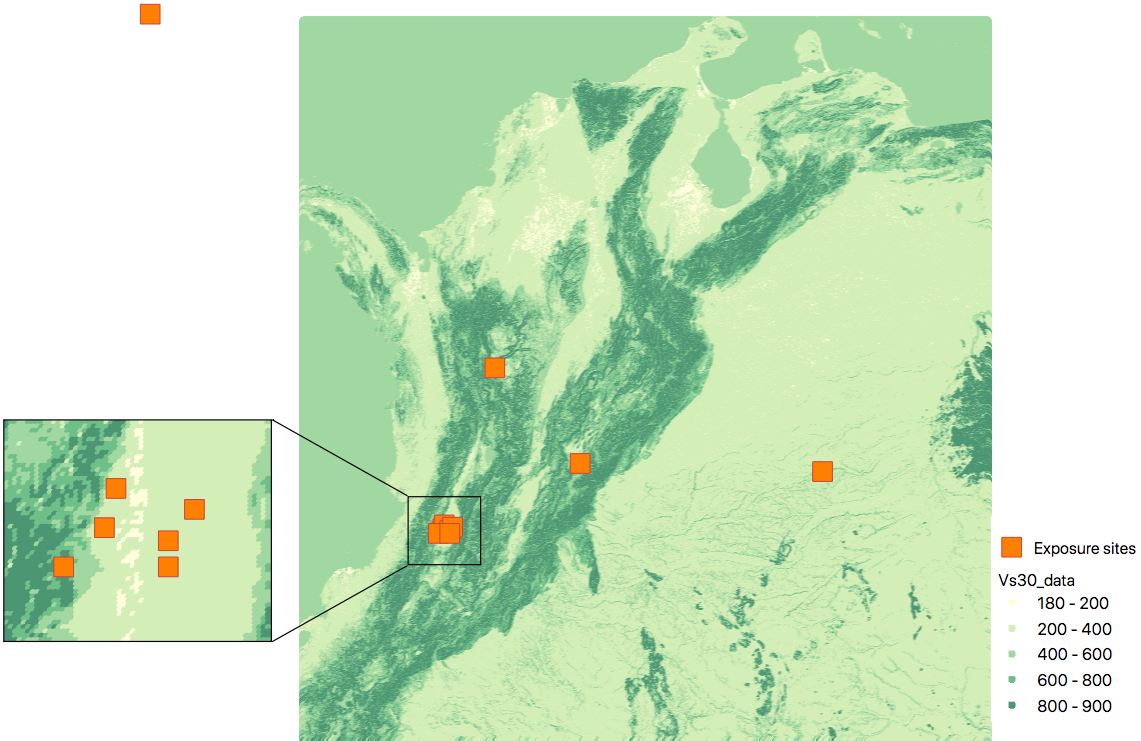
USGS Vs30 data and exposure locations#
Site model with non-gridded exposure (at the asset locations): The prepare_site_model command helps users to create a tailored site model file by associating the closest vs30 values at the locations of the exposure model.
Using the command
$ oq prepare_site_model -e Exposure.xml Vs30_values.csv
the resulting site model file contain the vs30 values closest to the exposure sites. The blue dots represent the generated site model file.

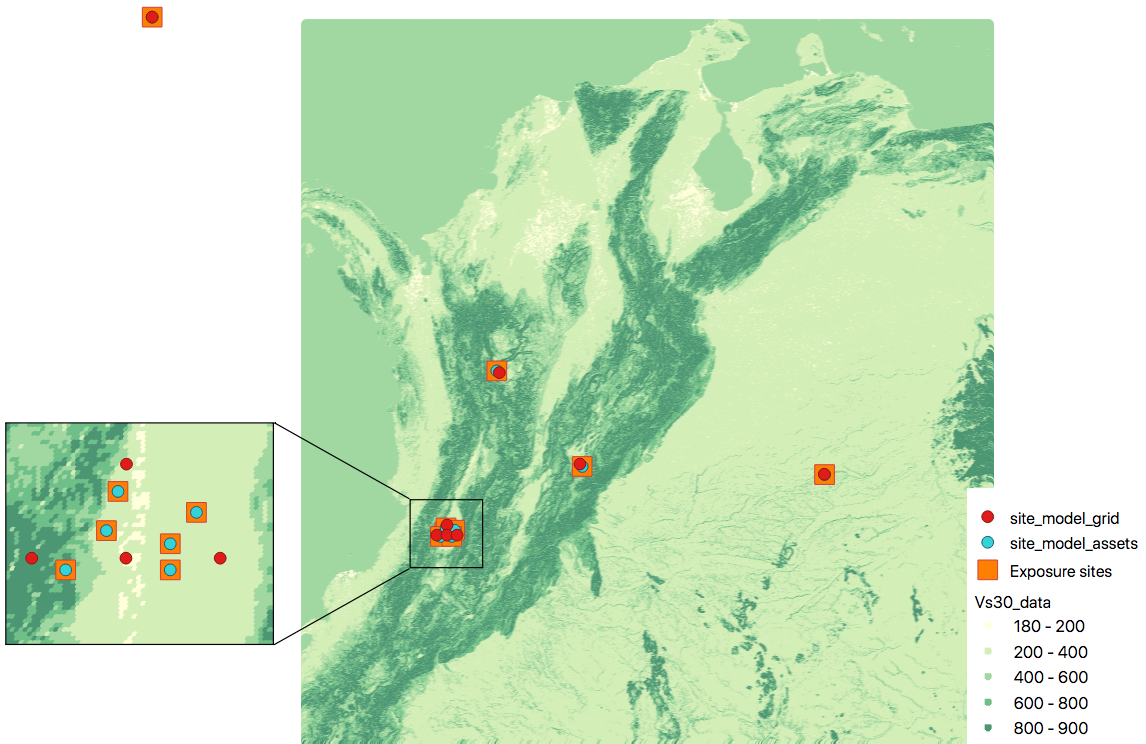
Site model with gridded exposure: When dealing with large exposure files (thousands of sites), it is possible to create an uniformly spaced grid. In this case the vs30 values will be the closest to the gridded points. This is possible by passing the flag -g distance_in_km.
Using the command
$ oq prepare_site_model -e Exposure.xml -g 20 Vs30_values.csv
the site model id generated with gridded points close to exposure sites (red dots), and the it considers the closest vs30 values to the gridded points. In this case a 20km grid was used.
oq show_attrs#
The command oq show_attrs offers a convenient way to retrieve the attributes of a calculation without needing to open the datastore with any external tools:
$ oq show_attrs -h
usage: oq show_attrs [-h] key [calc_id]

Show the attributes of a HDF5 dataset in the datastore.

positional arguments:
  key         key of the datastore
  calc_id     calculation ID [default: -1]

options:
  -h, --help  show this help message and exit
If the key / is requested, the root attributes are retrieved. For instance:
$ oq show_attrs / 4

checksum32 1572793419
date 2023-04-25T08:19:33
engine_version 3.17.0-gitcae0748
input_size 4021
If the calculation id is not specified, the value of the requested key is retrieved for the latest calculation.
Plotting commands#
The engine provides several plotting commands. They are all experimental and subject to change. They will always be. The official way to plot the engine results is by using the QGIS plugin. Still, the oq plotting commands are useful for debugging purposes. Here I will describe the plot_assets command, which allows to plot the exposure used in a calculation together with the hazard sites:
$ oq plot_assets --help
usage: oq plot_assets [-h] [calc_id]

Plot the sites and the assets

positional arguments:
  calc_id     a computation id [default: -1]

optional arguments:
  -h, --help  show this help message and exit
This is particularly interesting when the hazard sites do not coincide with the asset locations, which is normal when gridding the exposure.
Very often, it is interesting to plot the sources. While there is a primitive functionality for that in oq plot, we recommend to convert the sources into .gpkg format and use QGIS to plot them:
$ oq nrml_to --help
usage: oq nrml_to [-h] [-o .] [-c] {csv,gpkg} fnames [fnames ...]

Convert source models into CSV files or a geopackage.

positional arguments:
  {csv,gpkg}        csv or gpkg
  fnames            source model files in XML

optional arguments:
  -h, --help        show this help message and exit
  -o ., --outdir .  output directory
  -c, --chatty      display sources in progress
For instance $ oq nrml_to gpkg source_model.xml -o source_model.gpkg will convert the sources in .gpkg format while $ oq nrml_to csv source_model.xml -o source_model.csv will convert the sources in .csv format. Both are fully supported by QGIS. The CSV format has the advantage of being transparent and easily editable; it also can be imported in a geospatial database like Postgres, if needed.
Reducing the source model#
Source models are usually large, at the continental scale. If you are interested in a city or in a small region, it makes sense to reduce the model to only the sources that would affect the region, within the integration distance. To fulfil this purpose there is the oq reduce_sm command. The suggestion is run a preclassical calculation (i.e. set calculation_mode=preclassical in the job.ini) with the full model in the region of interest, keep track of the calculation ID and then run:
$ oq reduce_sm <calc_id>
The command will reduce the source model files and add an extension .bak to the original ones.:
$ oq reduce_sm -h
usage: oq reduce_sm [-h] calc_id

Reduce the source model of the given (pre)calculation by discarding all
sources that do not contribute to the hazard.

positional arguments:
  calc_id     calculation ID

optional arguments:
  -h, --help  show this help message and exit
Comparing hazard results#
If you are interested in sensitivity analysis, i.e. in how much the results of the engine change by tuning a parameter, the oq compare command is useful. It is able to compare many things, depending on the engine version. Here are a few examples:
$ oq compare hcurves --help
usage: oq compare hcurves [-h] [-f] [-s] [-r 0] [-a 0.001] imt calc_ids [calc_ids ...]

Compare the hazard curves of two or more calculations.

positional arguments:
  imt                   intensity measure type to compare
  calc_ids              calculation IDs

optional arguments:
  -h, --help            show this help message and exit
  -f, --files           write the results in multiple files
  -s , --samplesites    sites to sample (or fname with site IDs)
  -r 0, --rtol 0        relative tolerance
  -a 0.001, --atol 0.001
                        absolute tolerance

$ oq compare hmaps --help
usage: oq compare hmaps [-h] [-f] [-s] [-r 0] [-a 0.001] imt calc_ids [calc_ids ...]

Compare the hazard maps of two or more calculations.

positional arguments:
  imt                   intensity measure type to compare
  calc_ids              calculation IDs

optional arguments:
  -h, --help            show this help message and exit
  -f, --files           write the results in multiple files
  -s , --samplesites    sites to sample (or fname with site IDs)
  -r 0, --rtol 0        relative tolerance
  -a 0.001, --atol 0.001
                        absolute tolerance

$ oq compare uhs --help
usage: oq compare uhs [-h] [-f] [-s] [-r 0] [-a 0.001] calc_ids [calc_ids ...]

Compare the uniform hazard spectra of two or more calculations.

positional arguments:
  calc_ids              calculation IDs

optional arguments:
  -h, --help            show this help message and exit
  -f, --files           write the results in multiple files
  -s , --samplesites    sites to sample (or fname with site IDs)
  -r 0, --rtol 0        relative tolerance
  -a 0.001, --atol 0.001
                        absolute tolerance
Notice the compare uhs is able to compare all IMTs at once, so it is the most convenient to use if there are many IMTs.