Scenario-Based Damage Calculator#
Introduction#
The scenario damage calculator can be employed to estimate the distribution of damage due to a single earthquake, for a spatially distributed building portfolio. Similarly to what has been described for the scenario risk calculator, a finite earthquake rupture should be used to derive sets of ground-motion fields.
In this calculator, each ground-motion field is combined with a fragility model (discrete or continuous), in order to compute the fractions of buildings in each damage state. These fractions are calculated based on the difference in probabilities of exceedance between consecutive limit state curves at a given intensity measure level. This process is repeated for each ground-motion field, leading to a list of fractions for each asset. These results can then be multiplied by the respective number or area of buildings in order to obtain the absolute building damage distribution.
Calculation Steps#
For each ground-motion field, the intensity measure level at the location of the asset is used to derive the fraction of buildings in each damage state. In order to do so, the distance between each pair of consecutive limit states is calculated. This process is illustrated in the figure below, using a continuous fragility function.
When a continuous fragility function is used for the calculations, the fractions of building in each damage state are calculated using the analytical expression of the lognormal cumulative distribution functions. On the other hand, if a discrete fragility function was chosen, these fractions are computed using linear interpolation between the pair of points either side of the intensity measure level.
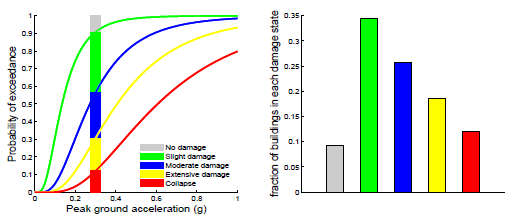
Representation of the fractions of building in each damage states, for a given intensity measure level (0.3 g).#
Step 1 is repeated for each ground-motion field, leading to a list of fractions (one per damage state), for each asset. From this list of values, the mean \((E[FR])\) and standard deviation \((SD[FR])\) for each fraction can be estimated using the following formulae:
Where m stands for the number of ground-motion fields simulated.
These fractions of buildings in each damage state can be multiplied by the quantity of the respective asset, leading to the mean and standard deviation of the number or area of buildings in each damage state (see the first figure below).
This calculator is also capable of estimating the aggregated number or area of buildings from the same taxonomy in each damage state (see the second figure below). In order to do so, for each ground-motion field, the absolute quantity of buildings in each damage state is calculated, and aggregated according to their taxonomy. After processing all the ground-motion fields, the associated statistics for each building taxonomy are calculated according to the formulae described in Step 2.
The total damage distribution is also calculated, by summing the quantity of buildings in each damage state, across all the assets existing in the building portfolio. This calculation will lead to a single damage distribution, represented by a mean and standard deviation for each damage state (see the third figure below).
Calculator Outputs#
The output of the Scenario Damage Calculator currently comprises damage distributions at three levels: per asset, per building taxonomy and total. In addition, with this calculator, it is also possible to extract collapse maps, which contain the spatial distribution of the number or area of collapsed buildings throughout the region of interest (see the fourth figure below). In the figures shown herein, examples of the outputs are depicted for a scenario event of magnitude 7.0Mw in the central region of Nepal.
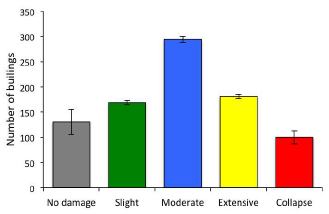
Damage distribution for a single asset.#
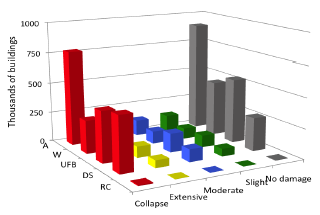
Damage distribution according to the building taxonomy.#
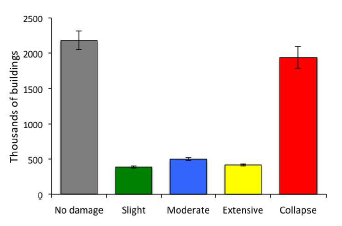
Damage distribution of the whole building portfolio.#
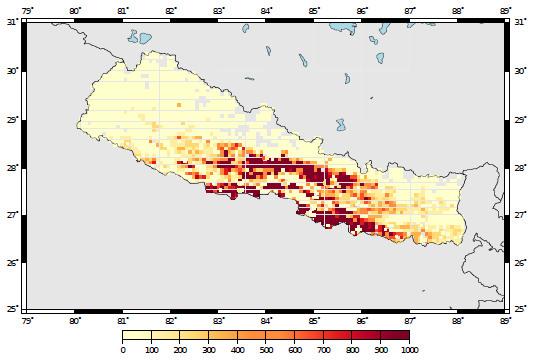
Collapse map considering the whole building portfolio.#