Global Exposure Model#
✨ Overview#
The
v2026.0.0release for the GEM’s global exposure model is now available! 🥳 🚀
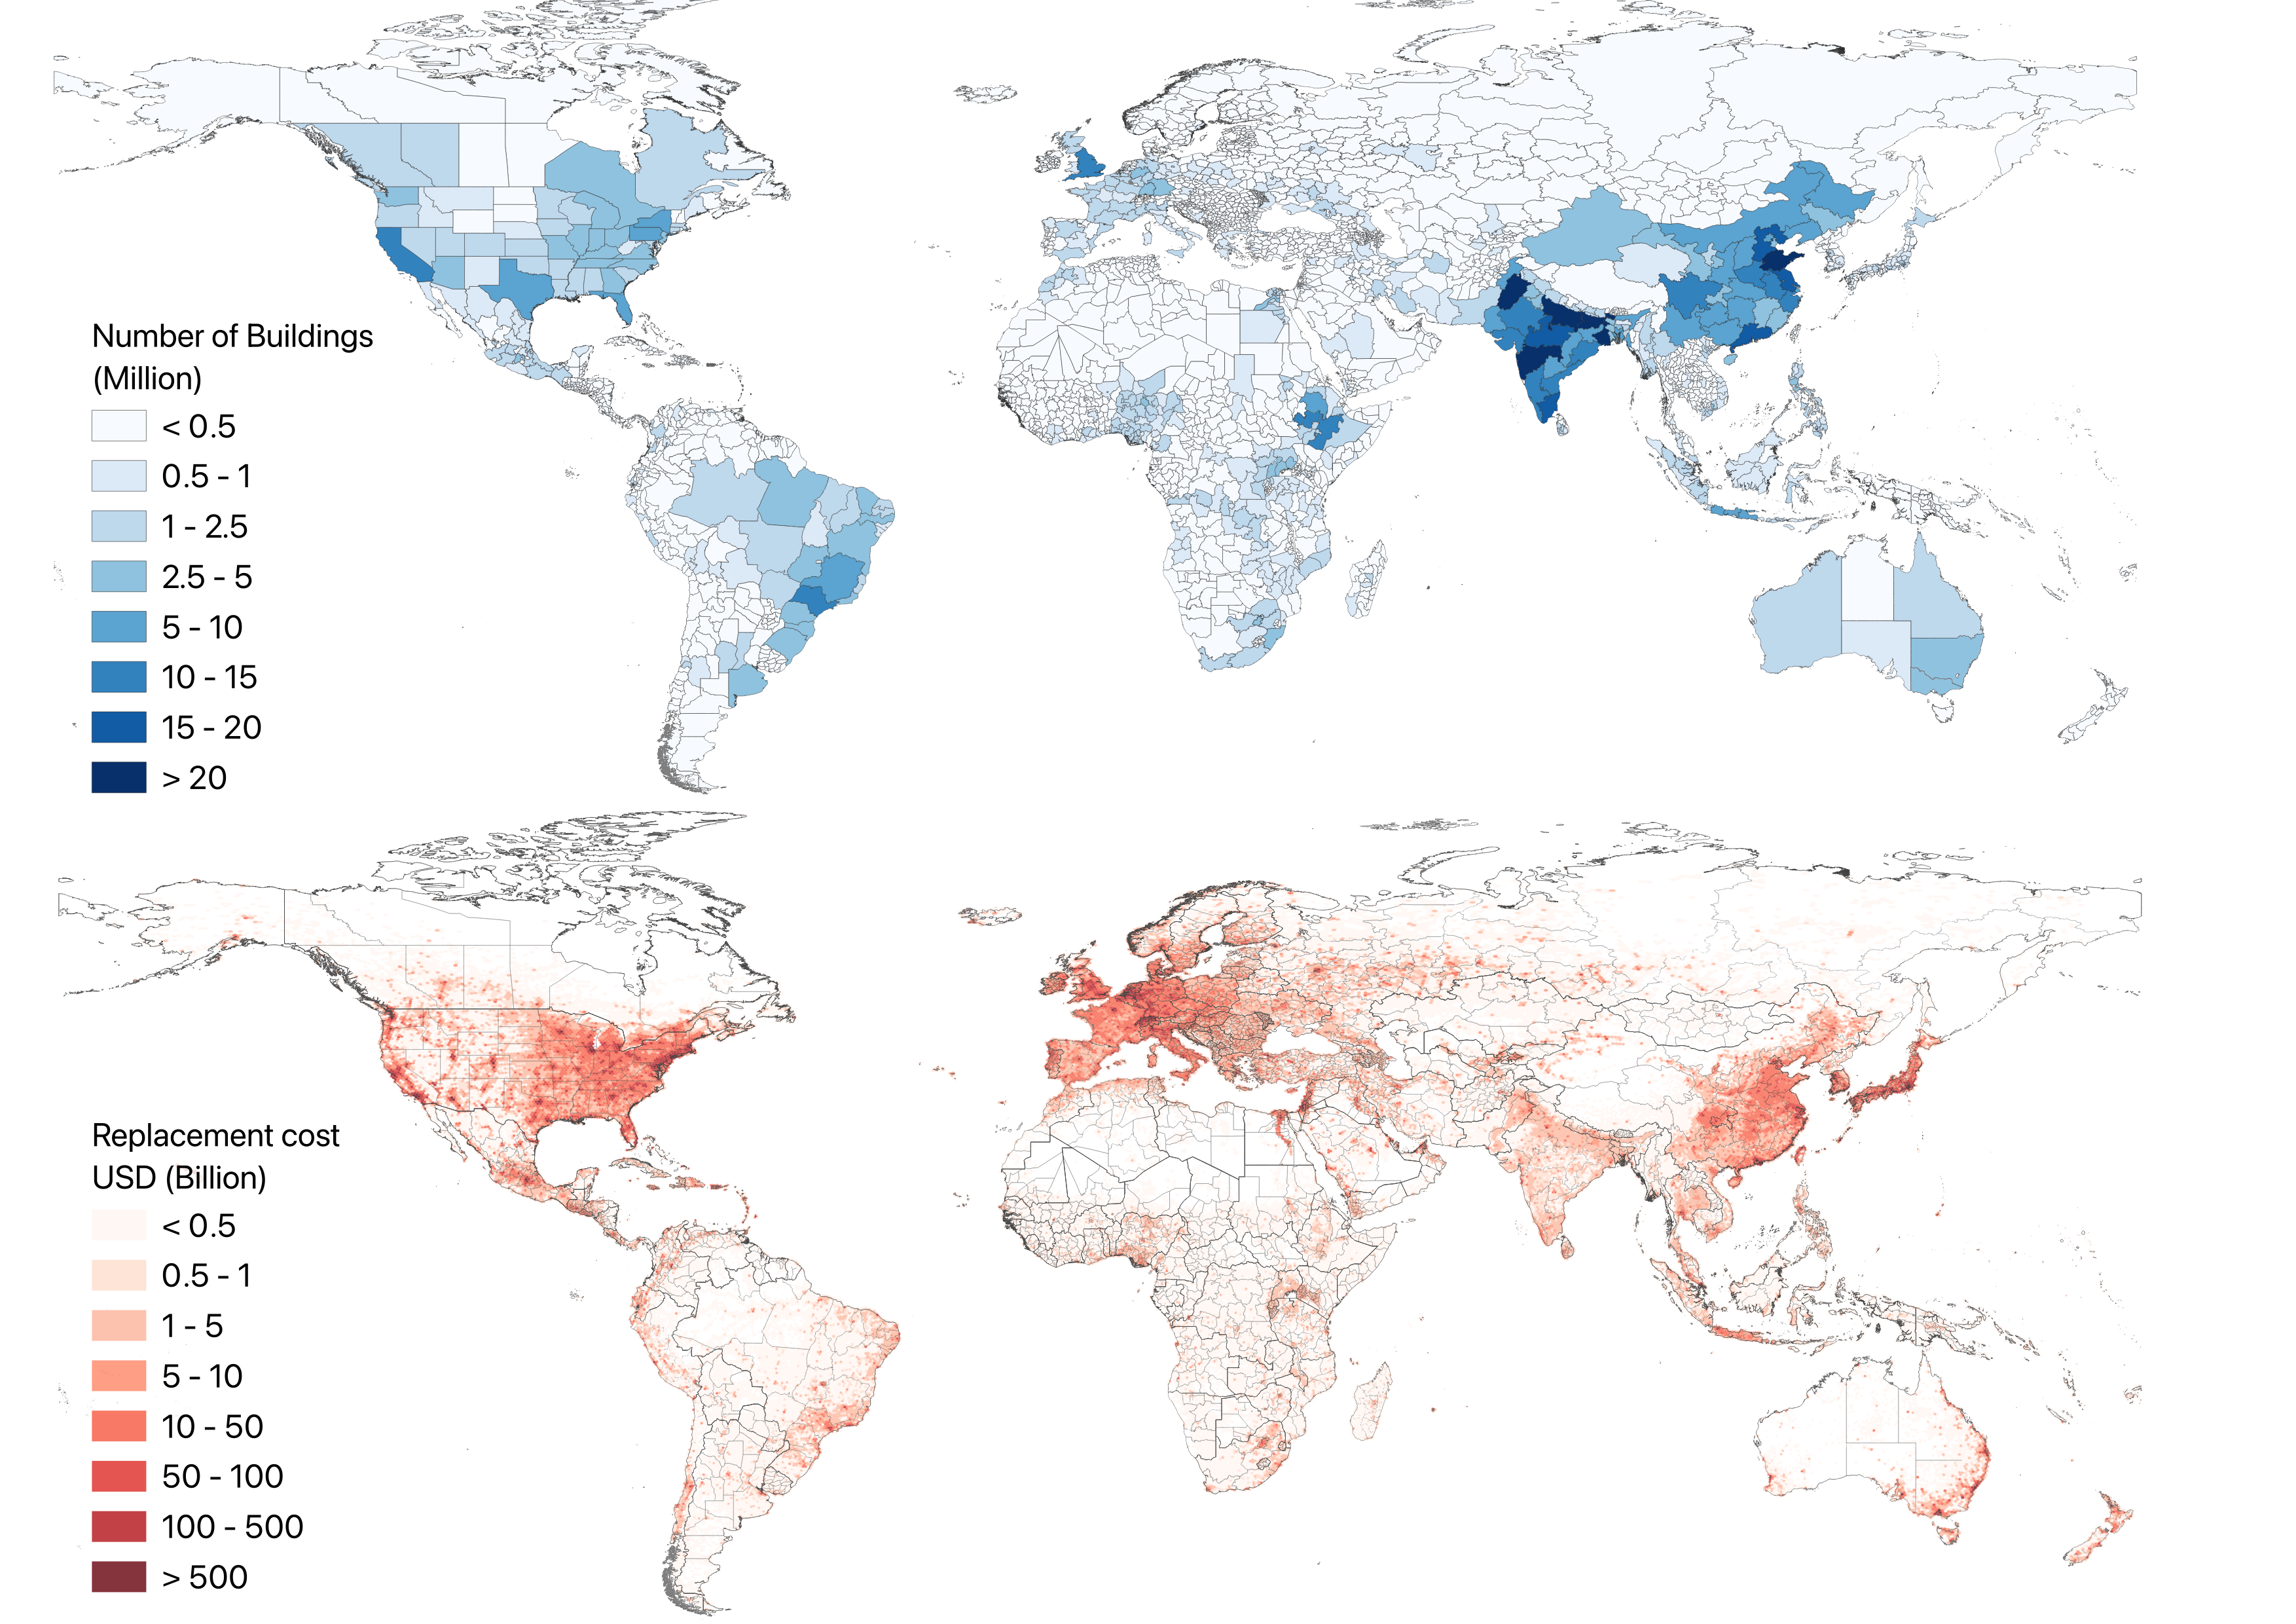
Figure: Exposure model. Number of building at the first-administrative devision (top), and spatial distribution of building counts aggregated onto a discrete hexagonal grid (bottom)
GEM’s Global Exposure Model covers 215 countries and territories. Exposure model insights help governments, insurers, and disaster response teams anticipate and mitigate earthquake impacts.
👥 Population and Building classes#
📍 Around 50% of the world population (~4.1 billion people) lives in areas exposed to moderate to high levels of seismic hazard (PGA > 0.10g on rock).
🏠 Almost half of the buildings in the world are made of unreinforced masonry (26%) or wood (20%).
🇮🇳 India is the country that concentrates the largest number of buiuldings (264 million)
💰 Economic value of Buildings#
🔢 $304 trillion is the estimated total replacement cost of buildings (residential, commercial and industrial) worldwide, based on our latest risk models.
🇺🇸 The United States of America concentrates the largest replacement cost, with $105 trillion.
🌎 >80% of the total replacement cost is concentrated in three regions: North America, East Asia, and Europe.
🏠 Buildings Vulnerability#
🚶♂️ More than 70% of the population in the world lives in buildings with no seismic provisions (vulnerable to earthquakes).
🔨 <10% of the buildings follow modern building codes with moderate to high earthquake performance standards.
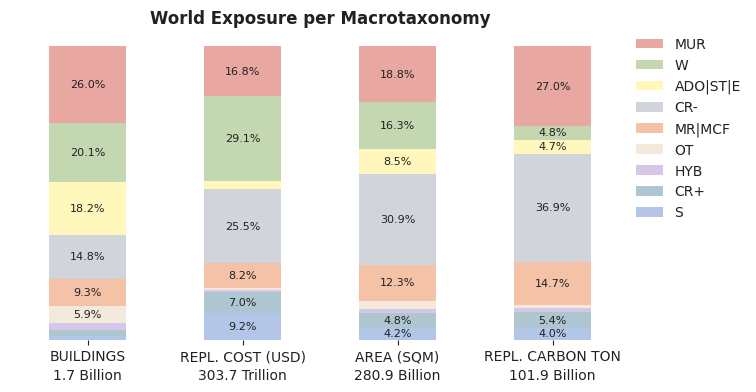
Figure: Global distribution of exposure by macro-taxonomy.
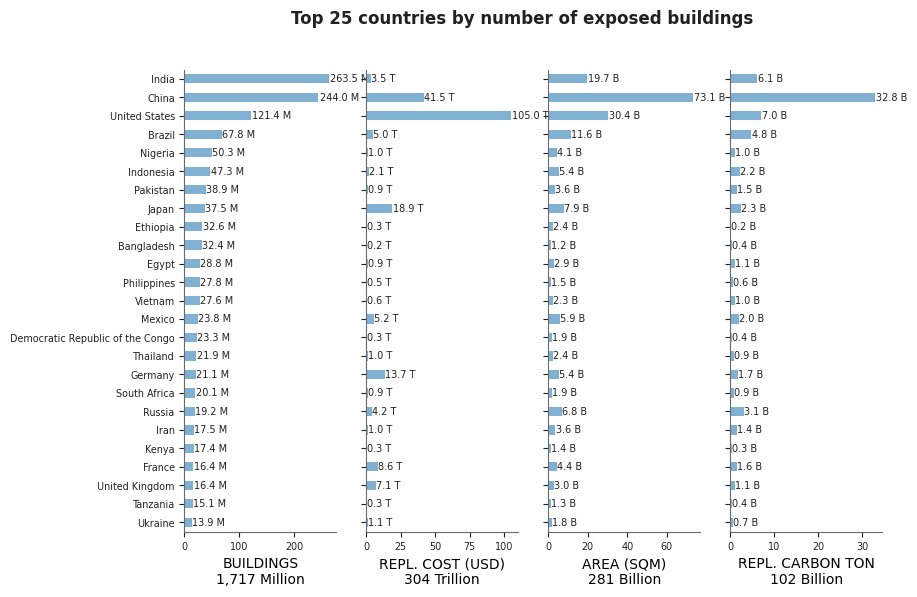
Figure: Top 25 countries by number of exposed buildings.
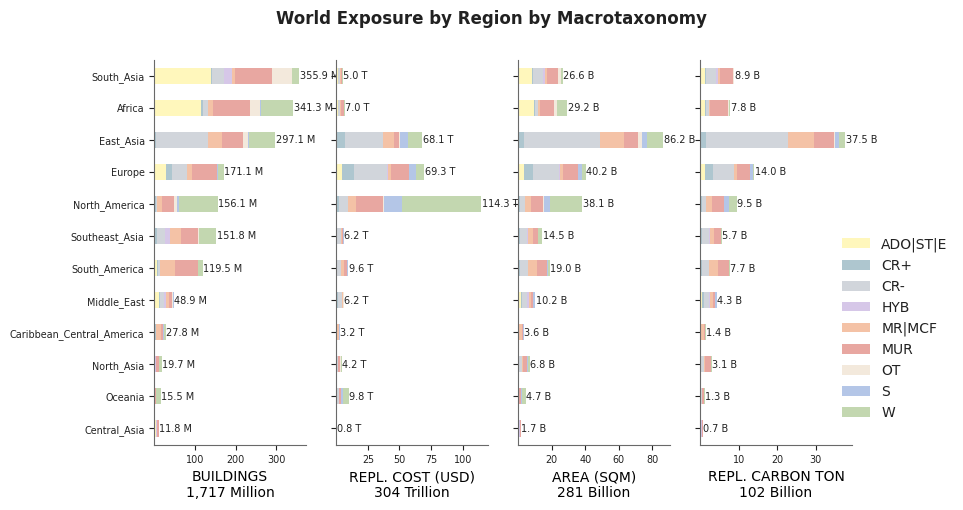
Figure: Global exposure by region and macrotaxonomy.
📂 Data structure#
The GEM Global Exposure Model is organized into a mosaic of exposure regions. Although these regions generally follow widely recognized geographic conventions, some adaptations were made to ensure consistency with the GEM Global Mosaic of Seismic Hazard Models. The model outputs are structured hierarchically by region, country, and territory.
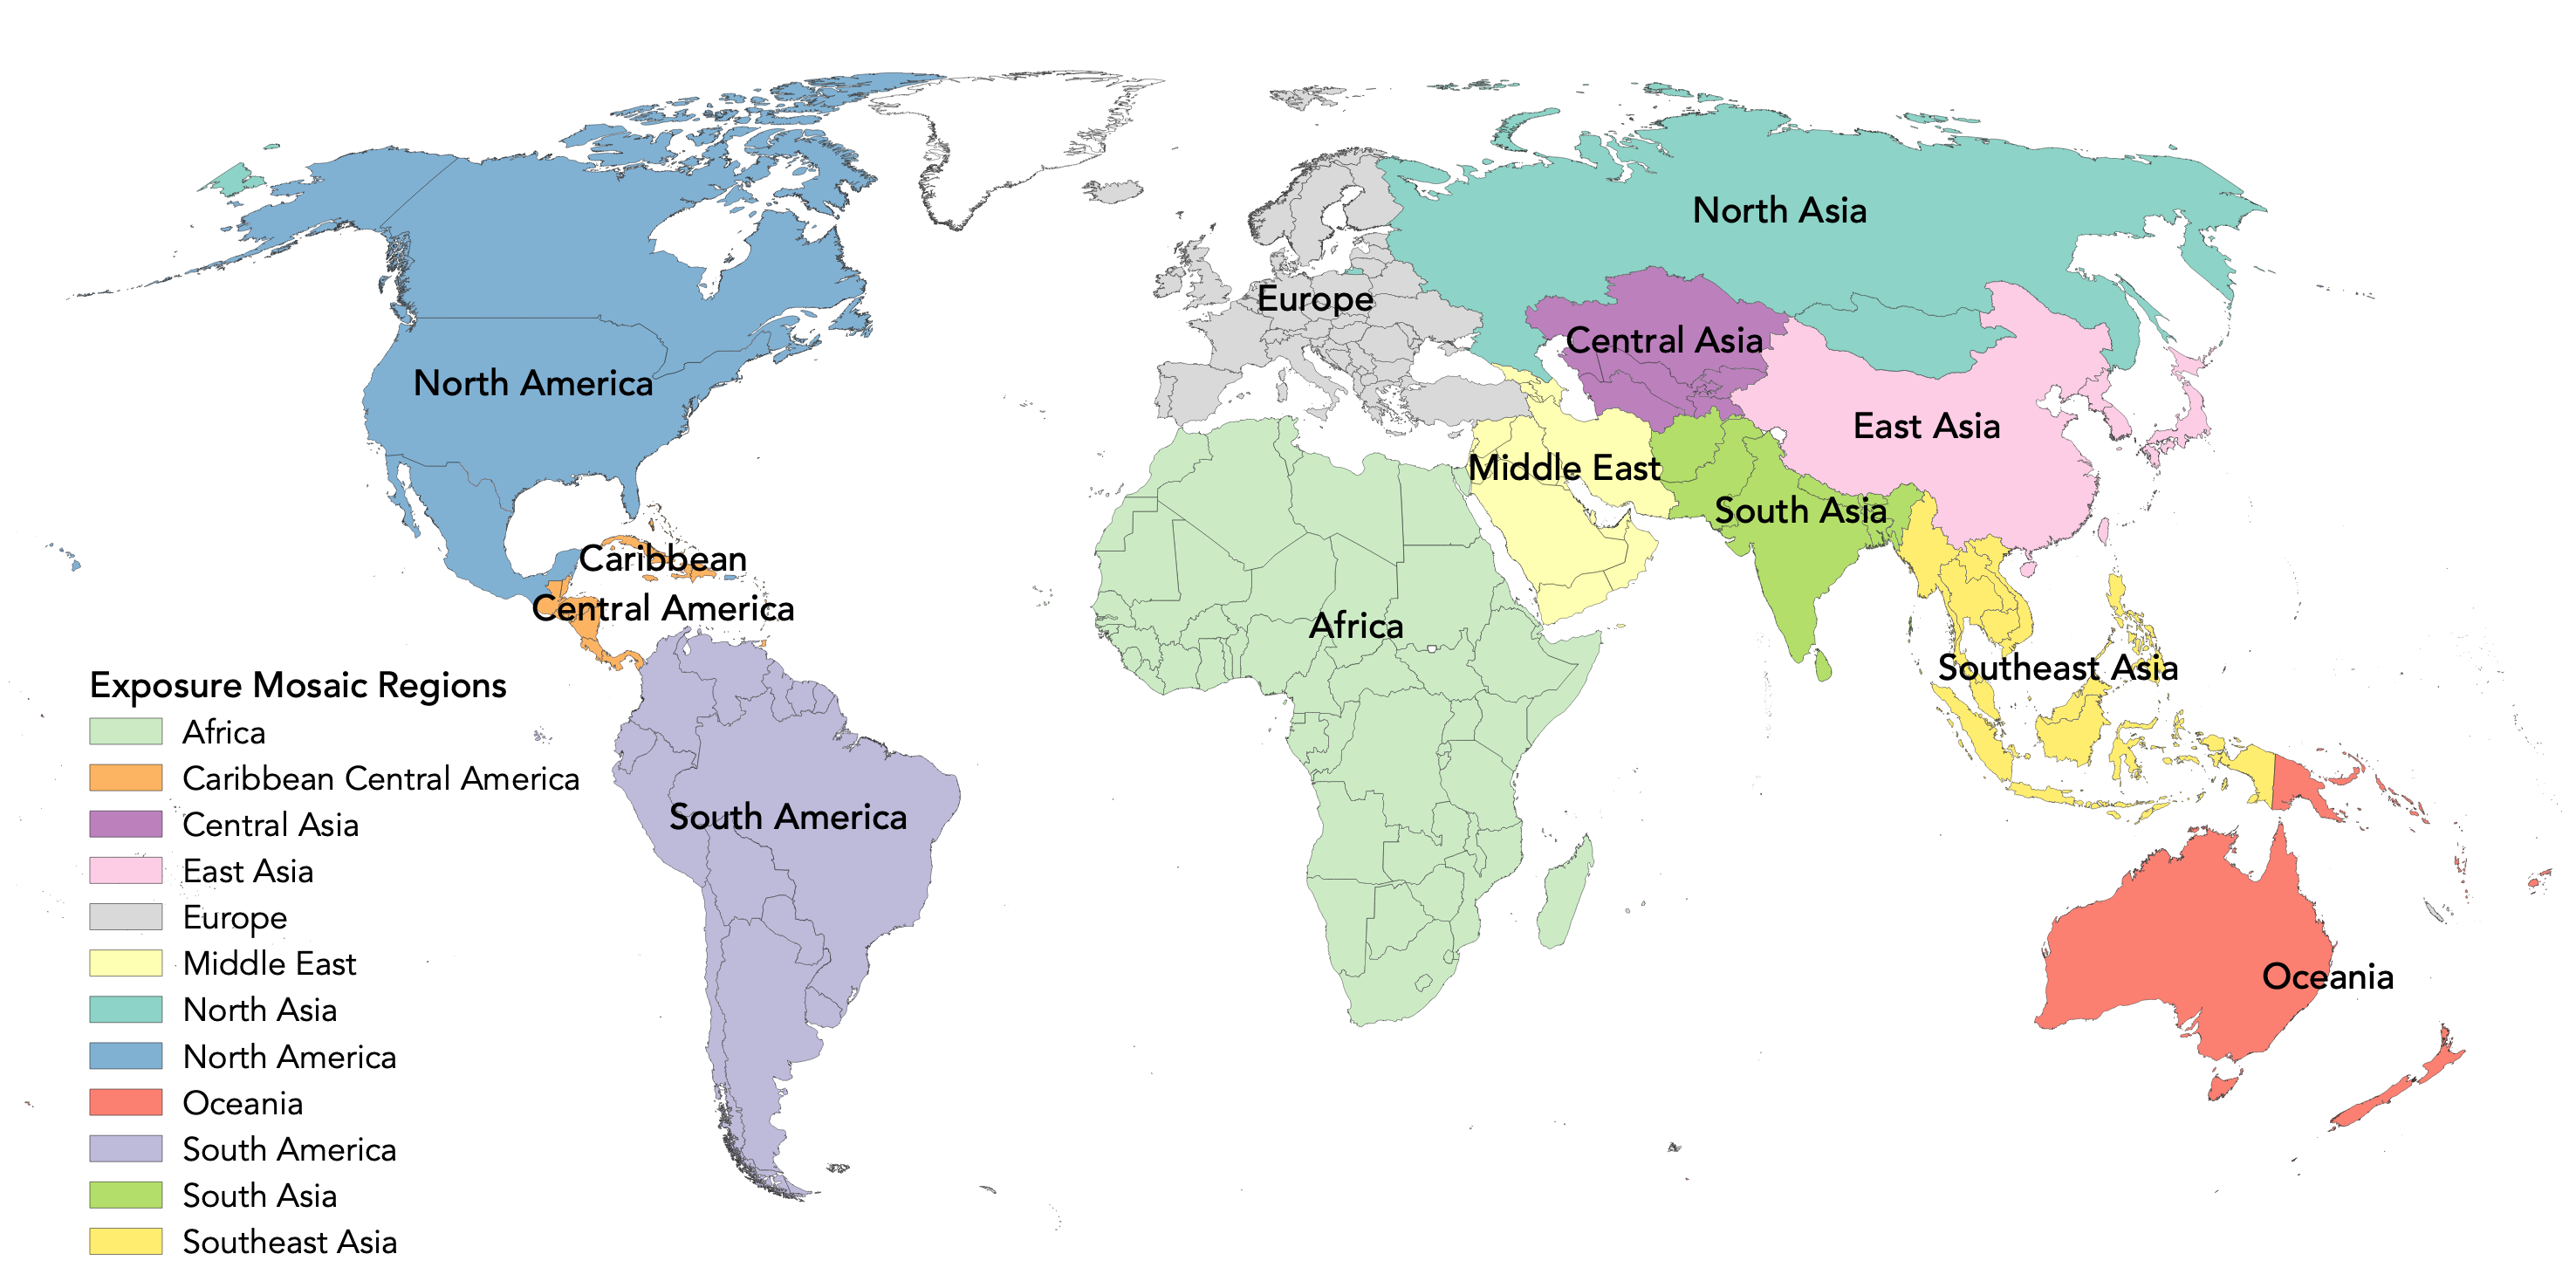
Figure: Mosaic of exposure and risk regions
A World directory contains the global results, while each regional directory contains subdirectories for the countries and territories within that region. Each country or territory directory includes the following information:
Summaries: CSV tables and figures summarizing building exposure at the national (Adm0), subnational (Adm1), and taxonomy levels.
Exposure model: Spatially disaggregated building exposure at 0.01 degrees (approximately 1km) resolution in
csv.gzformat, available for residential (RES), commercial (COM), and industrial (IND) occupancy classes.Vulnerability_mapping_ISO3.csv: Vulnerability mapping file per country or territory.
For more information, visit the GEM Global Risk Model documentation site. Spatially disaggregated models are also available and can be accessed by submitting a request through the GEM License Request page.
🚀 Model versions#
Each version of the model that is released can be accessed by changing from the main branch to the tag of a given version.
The main branch could contain the work-in-progress of the next version of the model.
Check out here how to change the version
Within each regional directory, detailed descriptions of model updates and revisions are provided in the CHANGELOG.md file located at the root of the region’s directory.
Version |
Release Notes |
|---|---|
Official GEM 2026 Global Release. Major update. See summary of changes in whats-new.md. |
|
Internal release adding updated country models |
|
Official June 2023 GEM Global Risk Model release. Updates include taxonomy consistency improvements, boundary-name revisions, exposure spatially disaggregated for many countries. |
|
Minor revision relative to |
|
Major update relative to |
|
Original version released as part of the 2018 Global Risk Model. |
🌟 Contributors#
The authors are grateful for the input from dozens of local and international experts. A list of contributors can be found at https://www.globalquakemodel.org/risk-model-contributors.
📚 Publications#
If you make use of this work, please cite both the publication and the data.
Publications:
Yepes-Estrada, C., Calderon, A., Costa, C., Crowley, H., Dabbeek, J., Hoyos, M., Martins, L., Paul, N., Rao, A., Silva, V. (2023). Global Building Exposure Model for Earthquake Risk Assessment. Earthquake Spectra. doi:10.1177/87552930231194048
Data:
Yepes-Estrada, C., Baiguera, M., Calderon, A., Caruso, M., Costa, C., Gonzalez, D., Nafeh, A.M.B., Rao, A., Silva, V. (2026). Global Exposure Model (2026.0.0). doi.org/10.5281/zenodo.8117363 ![]()
Regional and national model references#
Africa: Paul et al. (2022)[12]
Australia: Dunford and Power (2014)[6]
Canada: Journeay et al. (2022)[8]
Central America: Calderon et al. (2022)[3]
Central Asia: Pittore et al. (2020)[13]
China: Ma et al. (2021)[9]
Costa Rica: Calderon et al. (2019)[2]
Europe: Crowley et al. (2020)[4]
GED4GEM: Gamba et al. (2012)[7]
India: Rao et al. (2020)[14]
Iran: Motamed at al. (2019)[10]
Middle East: Dabbeek and Silva (2020)[5]
New Zealand: Abbott et al. (2020)[1]
Pacific Island Countries: PCRAFI initiative[11]
South America: Yepes-Estrada et al. (2017)[17]
Turkey: Rao et al. (2021)[15]
United States: USACE (2023)[16]
⚖️ License#
![]()
This work is licensed under a Creative Commons Attribution-NonCommercial-ShareAlike 4.0 International License, which requires:
Attribution (you must give appropriate credit, provide a link to the license, and indicate if changes were made)
Non-commercial (you may not use the material for commercial purposes)
ShareAlike (derivatives created must be made available under the same license as the original)
If your use case deviates from the requirements of the offered license, but still want to explore the use of the data, please contact us at license@globalquakemodel.org

Any deviation from these terms incurs license infringement. For commercial use of the data contained within this work, a specific license agreement must be made tailored to your use case, in such instance please contact GEM at product@globalquakemodel.org.
🤔 Frequently Asked Questions (FAQs)#
Which version am I seeing? How to change the version?#
By default you will see the files in the repository in the main branch. Each version of the model that is released is marked with a tag. By changing the tag version at the top of the repository, you can see the files for a given version.
Note that the main branch could contain the work-in-progress of the next version of the model.

How do I download the data for a given version?#
For each version, a released zip file is available: release zip file downloads.
Where can I find additional information on the defined building classes?#
The building classes defined within this exposure model follow the GEM Building Taxonomy v4.0. The link provides additional details on taxonomy substrings, images and detailed description of each attribute.
Building classes are mapped to corresponding vulnerability functions available in the GEM’s Global Vulnerability Model. Inside each country there is available a Vulnerability_mapping_ISO3.csv file useful for earthquake risk assessment using the OpenQuake engine.
What do the column headers mean?#
Definitions and descriptions of the columns in the exposure summary tables.
👀 click to see definitions and descriptions
HEADER |
DESCRIPTION |
|---|---|
ASSET_ID |
Unique identifier for an asset, which comprises a group of buildings sharing similar attributes and location |
ID_0 |
ISO3 code for the country |
NAME_0 |
English name for the country |
ID_1 |
ID for the first administrative level, matches either the ID used in the national census or in the administrative division boundary vector files, or both |
NAME_1 |
Name of the first administrative level |
ID_i |
ID for the “ith” administrative level |
NAME_i |
Name of the “ith” administrative level |
LONGITUDE |
Geographical longitude cordinate of the asset location. In general, these locations do not represent building-specific geolocations, they represent points as a result of a spatial disaggregation algorithm (and thus still represent aggregated assets) but at a finer resolution. |
LATITUDE |
Geographical latitude cordinate of the asset location. In general, these locations do not represent building-specific geolocations, they represent points as a result of a spatial disaggregation algorithm (and thus still represent aggregated assets) but at a finer resolution. |
OCCUPANCY |
Primary occupancy class (RES: residential; COM: commercial; IND: industrial) |
OCCUPANCY_TYPE |
Detailed occupancy providing a finer classification within the primary OCCUPANCY class, describing the specific functional use of the structure as defined in the GEM taxonomy (e.g., [RES:1] single dwelling; [COM:3C] hotels and motels; [IND:2] light-industry factories). |
SETTLEMENT |
Type of settlement (e.g., URBAN, RURAL, SUBURBAN, URBAN_CENTER) |
TAXONOMY |
Building taxonomy string that is used for mapping vulnerability functions for the asset |
TAXONOMY_HAZUS |
Building taxonomy string compatible with HAZUS classification |
MACRO_TAXONOMY |
High-level classification of building types used in the Global Exposure Model for statistical analysis |
BUILDINGS |
The total number of buildings comprising the asset. A building unit is defined as a permanent, separate, and independent structure designed to serve any activity. For constructions comprising blocks, terraced buildings, or buildings enclosed by common fencing, a building unit refers to the superstructure that is structurally designed to respond independently under seismic loads |
DWELLINGS |
The total number of dwellings comprising the asset. A dwelling unit is defined as a self-contained residential space within a building designed for habitation by one or more individuals or families. For example, a multi-story residential building is comprised of numerous dwelling units, such as multiple apartments within the same structure. Conversely, in a single-family detached unit, the number of dwelling units and buildings is the same |
ESTABLISHMENTS |
The total number of establishments comprising the asset. An establishment is defined as a single physical location where economic activities occur (e.g., services or industrial operations). An establishment is often characterized by having a specific address, management, and operational control, distinct from other units of the same company or organization. |
OCCUPANTS_TOTAL |
The number of residents in each residential asset |
OCCUPANTS_DAY |
The average number of occupants in each asset during the day-time period |
OCCUPANTS_TRANSIT |
The average number of occupants in each asset during the transit time period |
OCCUPANTS_NIGHT |
The average number of occupants in each asset during the night-time period |
OCCUPANTS_AVERAGE |
The time-averaged number of occupants in each asset (residential, commercial, industrial) |
AVG_DWL_AREA_SQM |
Floor area of a dwelling unit (sqm) |
TOTAL_AREA_SQM |
The total floor area comprising the asset (sqm) |
COST_PER_AREA_USD |
The average building cost (as built) per unit area (in US dollars). It includes the structural and nonstructural components, but not the building contents. |
COST_PER_AREA_LOCAL |
Idem as COST_PER_AREA_USD but using the local currency |
BLDG_REPL_COST_USD |
Cost to construct or replace the building components (structural and nonstructural) of the asset. It does not includues the contents. |
COST_STRUCTURAL_USD |
Cost to construct or replace (as built) in US dollars of structural components in each asset |
COST_NONSTRUCTURAL_USD |
Cost to construct or replace (as built) in US dollars of nonstructural components in each asset |
COST_CONTENTS_USD |
Cost to construct or replace (as built) in US dollars of contents in each asset |
TOTAL_REPL_COST_USD |
Cost to construct or replace the asset with equal quality and construction in US dollars (including the structural, nonstructural components, and building contents) |
YEAR |
Year of construction or retrofit |
CARBON_BUILDINGS_TON |
The building replacement embodied carbon in Ton CO2e for the asset, including structural and nonstructural components (no building contents) |