Global Overview#
The GEM Global Risk Model provides a comprehensive earthquake risk assessment. The model presents the geographic distribution of potential impacts including economic losses, fatalities, damaged buildings, and affected populations across residential, commercial, and industrial building sectors.
215 countries and territories covered
12 regional mosaics for detailed analysis
Multi-scale assessment from global to local
Standardized methodologies across all regions
Hazard Models: Seismic ground motion assessment
Exposure Models: Building stock and population distribution
Vulnerability Models: Damage and loss estimation
Risk Assessment: Integrated impact quantification
Model Scope and Limitations#
The current model focuses on ground shaking effects from earthquakes and provides the foundation for multi-hazard risk assessment. The model does not currently include:
Secondary earthquake effects (tsunamis, liquefaction, landslides)
Fire following earthquakes
Other natural hazards (floods, cyclones, etc.)
Future model versions will expand to include additional hazard types and secondary effects.
Key Model Applications#
Comparative risk studies
Methodology development
Vulnerability research
Loss model validation
National risk assessments
Building code development
Insurance applications
Disaster preparedness planning
Emergency response planning
Post-disaster impact estimation
Risk communication
Investment prioritization
Global Exposure Model#
✨ Overview#
The
v2026.0.0release for the GEM’s global exposure model is now available! 🥳 🚀
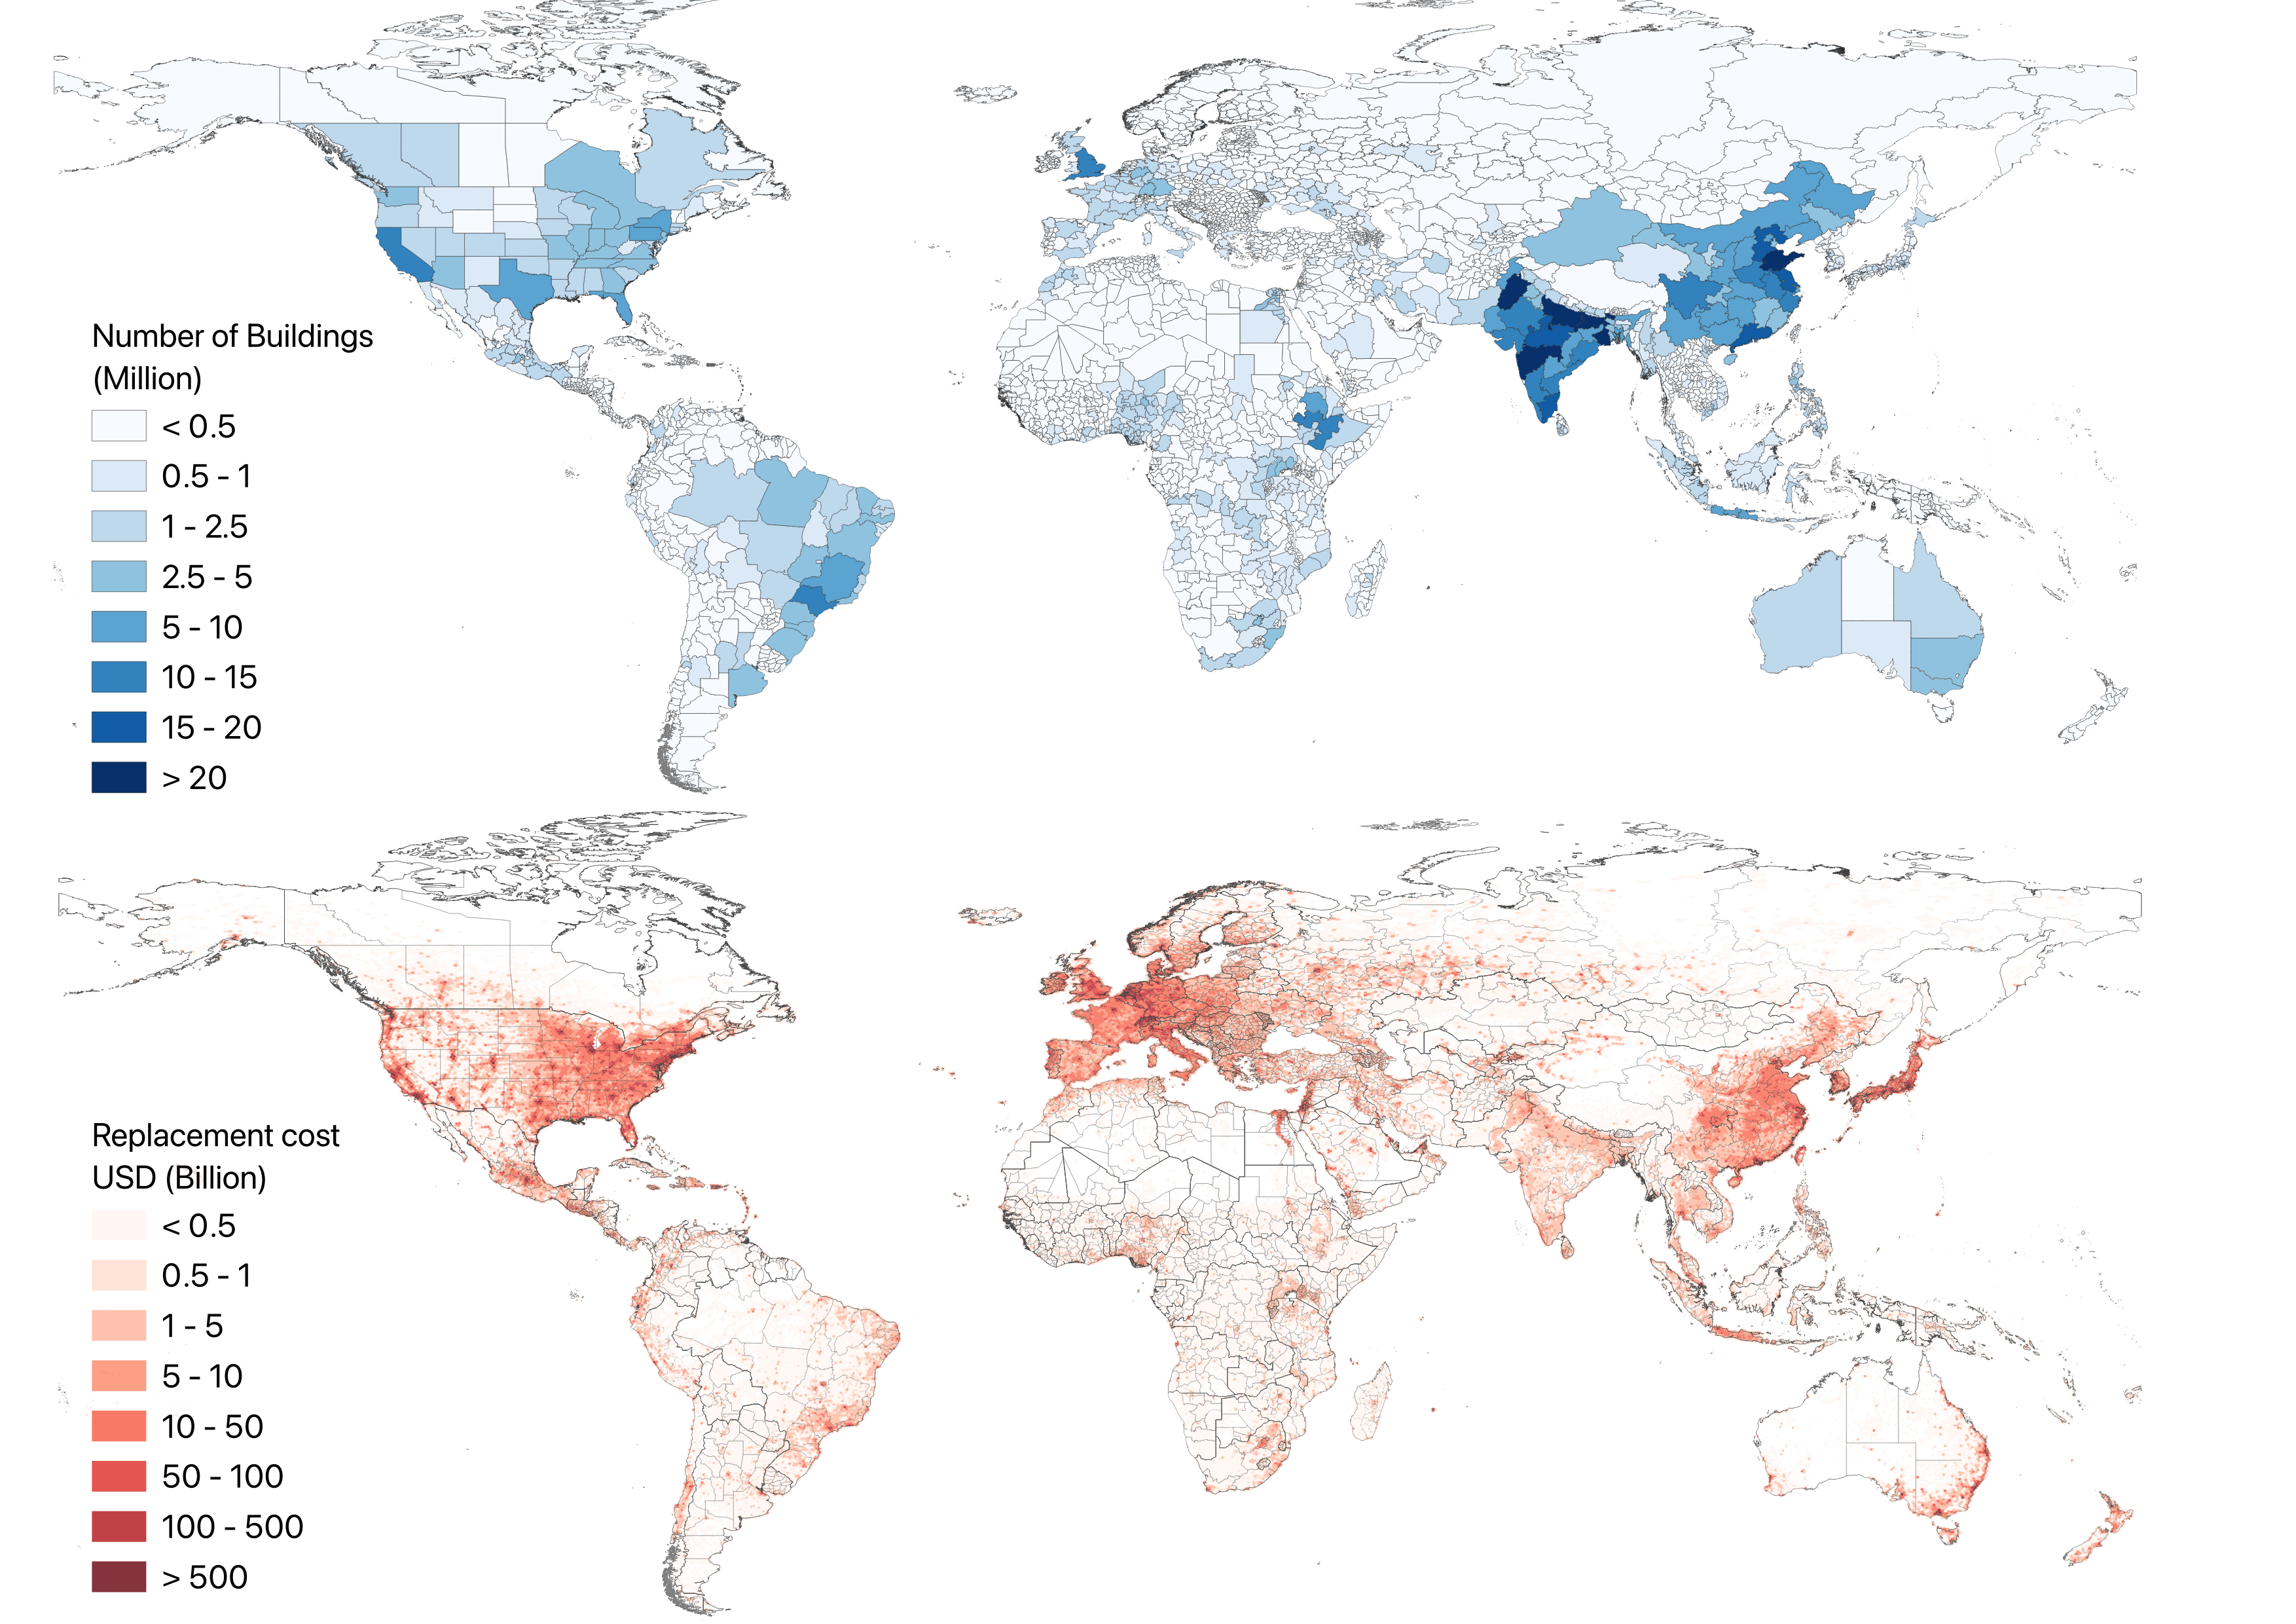
Figure: Exposure model. Number of buildings at the first-administrative devision (top), and spatial distribution of building counts aggregated onto a discrete hexagonal grid (bottom)
GEM’s Global Exposure Model covers 215 countries and territories. Exposure model insights help governments, insurers, and disaster response teams anticipate and mitigate earthquake impacts.
👥 Population and Building classes#
📍 Around 50% of the world population (~4.1 billion people) lives in areas exposed to moderate to high levels of seismic hazard (PGA > 0.10g on rock).
🏠 Almost half of the buildings in the world are made of unreinforced masonry (26%) or wood (20%).
🇮🇳 India is the country that concentrates the largest number of buiuldings (264 million)
💰 Economic value of Buildings#
🔢 $304 trillion is the estimated total replacement cost of buildings (residential, commercial and industrial) worldwide, based on our latest risk models.
🇺🇸 The United States of America concentrates the largest replacement cost, with $105 trillion.
🌎 >80% of the total replacement cost is concentrated in three regions: North America, East Asia, and Europe.
🏠 Buildings Vulnerability#
🚶♂️ More than 70% of the population in the world lives in buildings with no seismic provisions (vulnerable to earthquakes).
🔨 <10% of the buildings follow modern building codes with moderate to high earthquake performance standards.
Global Risk Model#
The v2026.0.0 release for the Global Risk Model is now available! 🥳 🚀
Explanation of profile content#
The GEM Foundation has produced a collection of Country-Territory Seismic Risk Profiles that summarize key metrics of seismic risk, allowing stakeholders in risk management to get an overview of the risk in a region at-a-glance. Each profile presents the following relevant information:
Social indicators, which provide context to the region in question
Risk indicators, detailing an occupancy breakdown of exposed value and losses
A list of the major earthquakes that have impacted the region
Loss per region, providing a breakdown of average annual losses per administrative level 1
Building classes, depicting the major construction materials used in the region
Loss curves, which provide expected losses per different return periods
Maps depicting the geographical distribution of hazard, exposure, and losses
The risk values presented are the results of an event-based risk analysis, where 100,000 years of earthquakes are simulated. Three lines of business are considered: residential, commercial, and industrial. Therefore, the value or earthquake losses from damage to other building occupancies (e.g., schools, healthcare) and infrastructure are not included.