Reinforced masonry#
General description#
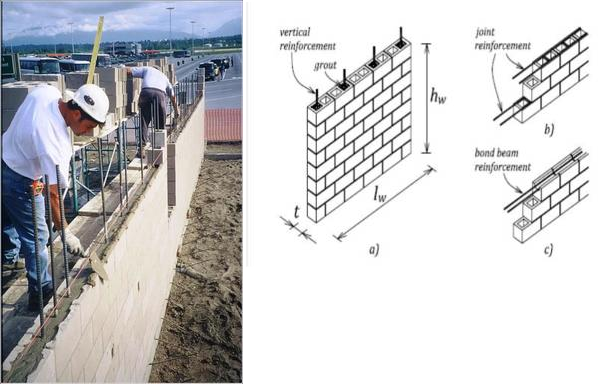
Description: Masonry wall construction in which reinforcement is embedded in such a manner that two materials act together in resisting forces. The reinforcement resists tension while the masonry resists compression. Reinforcement can take various forms, such as internal steel or wooden rods or bars grouted into masonry units or laid in horizontal mortar courses. Alternatively, vertical and/or horizontal wood or reinforced concrete posts or bands can be provided to increase the strength of individual building elements like walls and or tie them together. In some cases, textile reinforcing which is plastered over is used to reinforce masonry walls GEM taxonomy: MR/LWAL+DUL/H:1-5; MR/LWAL+DUM/H:1-5; MR/LWAL+DUH/H:1-5
Capacity parameters#
Building class |
Yield drift [%] |
Ultimate drift [%] |
Ty [s]=f(Height [m]) |
Yield period [s] |
|---|---|---|---|---|
MR/LWAL+DUL/H1 |
0.18 |
0.8 |
0.06014*H^0.87 |
0.15 |
MR/LWAL+DUL/H2 |
0.18 |
0.8 |
0.06014*H^0.87 |
0.27 |
MR/LWAL+DUL/H3 |
0.18 |
0.8 |
0.06014*H^0.87 |
0.38 |
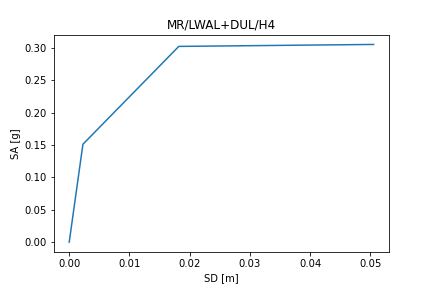
MR/LWAL+DUL/H4 |
0.18 |
0.8 |
0.06014*H^0.87 |
0.49 |
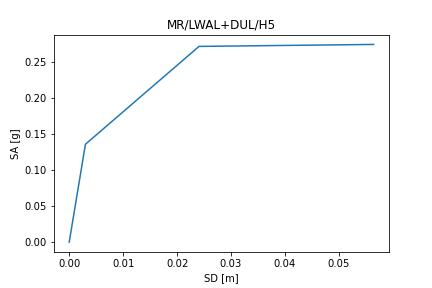
MR/LWAL+DUL/H5 |
0.18 |
0.8 |
0.06014*H^0.87 |
0.6 |
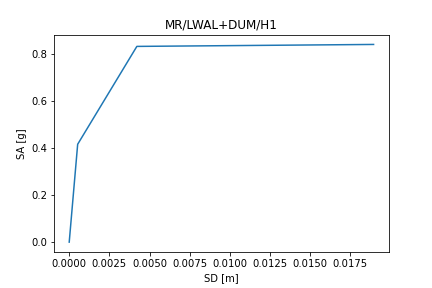
MR/LWAL+DUM/H1 |
0.2 |
0.9 |
0.05828*H^0.87 |
0.14 |
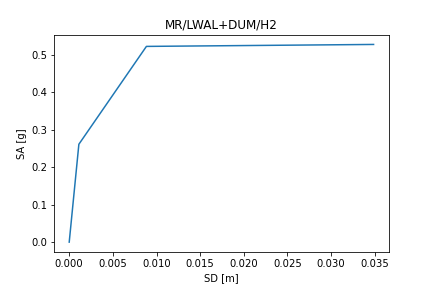
MR/LWAL+DUM/H2 |
0.2 |
0.9 |
0.05828*H^0.87 |
0.26 |
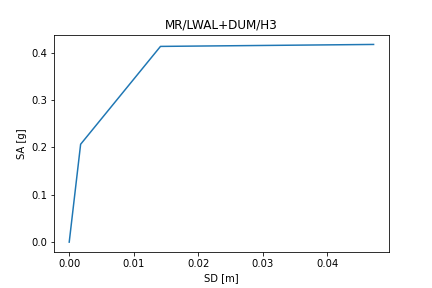
MR/LWAL+DUM/H3 |
0.2 |
0.9 |
0.05828*H^0.87 |
0.37 |
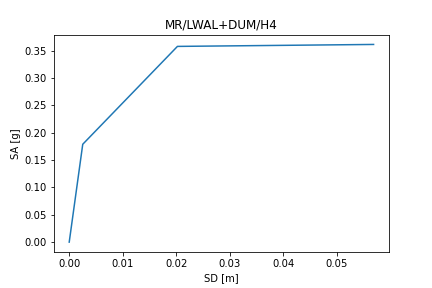
MR/LWAL+DUM/H4 |
0.2 |
0.9 |
0.05828*H^0.87 |
0.48 |
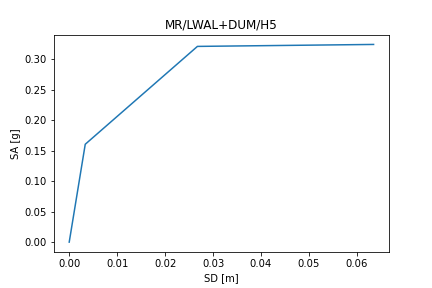
MR/LWAL+DUM/H5 |
0.2 |
0.9 |
0.05828*H^0.87 |
0.58 |
MR/LWAL+DUH/H1 |
0.22 |
1.0 |
0.05642*H^0.87 |
0.14 |
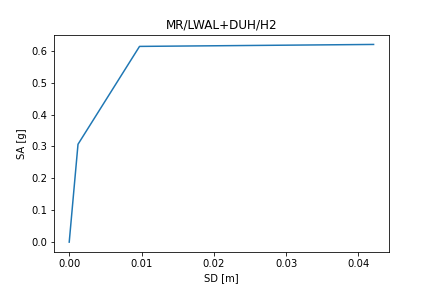
MR/LWAL+DUH/H2 |
0.22 |
1.0 |
0.05642*H^0.87 |
0.25 |
MR/LWAL+DUH/H3 |
0.22 |
1.0 |
0.05642*H^0.87 |
0.36 |
MR/LWAL+DUH/H4 |
0.22 |
1.0 |
0.05642*H^0.87 |
0.46 |
MR/LWAL+DUH/H5 |
0.22 |
1.0 |
0.05642*H^0.87 |
0.56 |
MR/LWAL+DUL/H1/CCA |
0.18 |
0.8 |
0.0556295*H^0.87 |
0.14 |
MR/LWAL+DUL/H2/CCA |
0.18 |
0.8 |
0.0556295*H^0.87 |
0.25 |
MR/LWAL+DUL/H3/CCA |
0.18 |
0.8 |
0.0556295*H^0.87 |
0.35 |
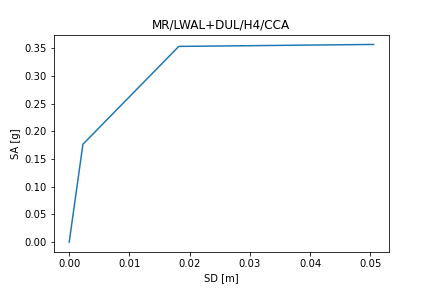
MR/LWAL+DUL/H4/CCA |
0.18 |
0.8 |
0.0556295*H^0.87 |
0.46 |
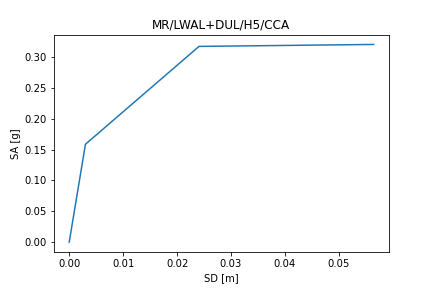
MR/LWAL+DUL/H5/CCA |
0.18 |
0.8 |
0.0556295*H^0.87 |
0.55 |
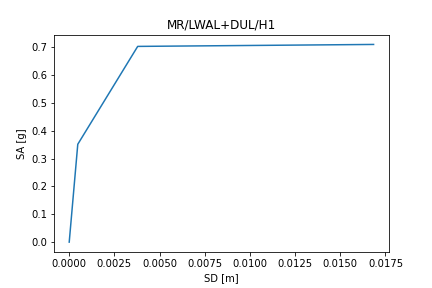
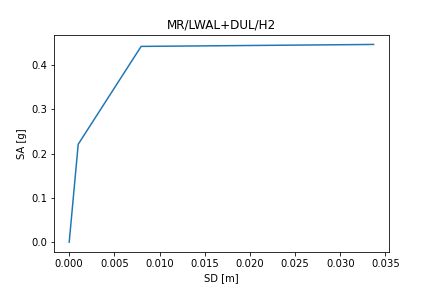
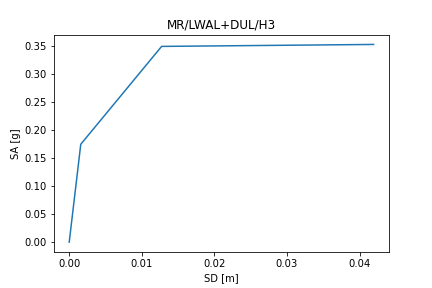
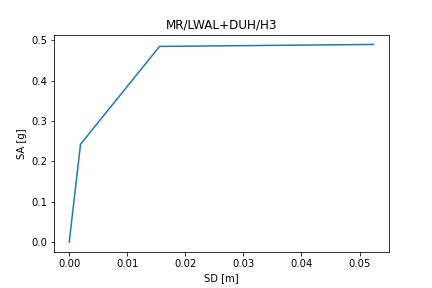
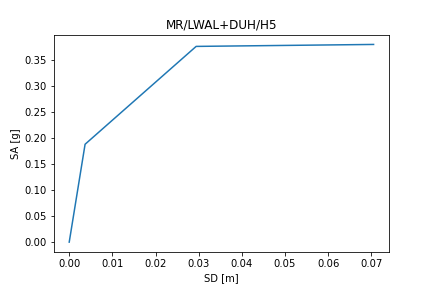
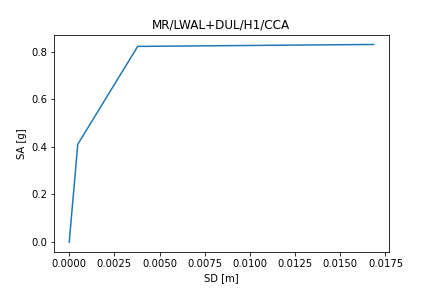
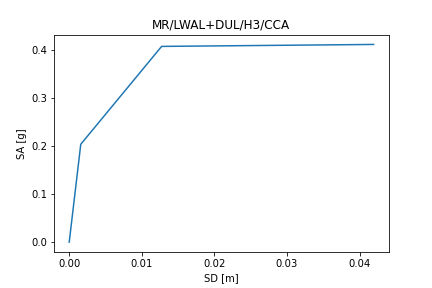
Capacity plots#


References#
A list of references and respective capacity parameters consulted during the definition of GEM’s capacity curves is presented below.
Reference |
URL |
Yield drift [%] |
Ult drift [%] |
Ty=f(H) [s] |
|---|---|---|---|---|
Lofty et al 2019 |
https://doi.org/10.1080/13632469.2019.1659881 |
- |
0.69-3.00 |
- |
Murcia-Delso et al 2012 |
https://doi.org/10.1193/1.4000075 |
- |
0.40-2.20 |
- |
FEMA 2020 |
https://www.fema.gov/sites/default/files/2020-10/fema_hazus_earthquake_technical_manual_4-2.pdf |
0.08-0.45 |
0.51-5.68 |
0.033*H |
Voon and Inghan 2006 |
https://doi.org/10.1061/(ASCE)0733-9445(2006)132:3(400) |
0.22-0.56 |
0.33-0.78 |
- |
Shedid et al 2008 |
https://doi.org/10.1061/(ASCE)0733-9445(2008)134:11(1754) |
0.67-0.95 |
1.26-2.21 |
- |
Haach et al 2010 |
https://doi.org/10.1061/(ASCE)ST.1943-541X.0000125 |
0.04-0.19 |
0.52-1.04 |
- |