Confined Masonry#
General description#
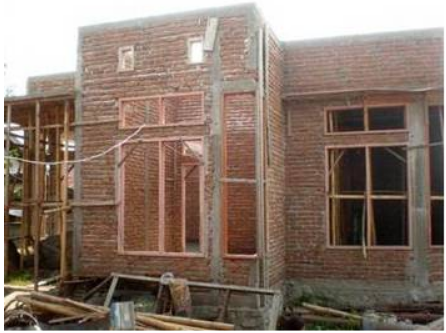
Description:Masonry construction where masonry walls are first laid and then horizontal and vertical reinforced concrete confining elements are cast. In this type of construction the concrete bonds to the masonry and the small-size columns and beams (called tie-columns and tie-beams) confine masonry wall panels. GEM taxonomy:MCF/LWAL+DUL/H1:5; MCF/LWAL+DUM/H1:5; MCF/LWAL+DUH/H1:5
Capacity parameters#
Building class |
Yield drift [%] |
Ultimate drift [%] |
Ty [s]=f(Height [m]) |
Yield period [s] |
|---|---|---|---|---|
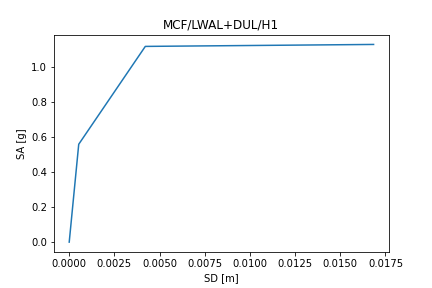
MCF/LWAL+DUL/H1 |
0.2 |
0.8 |
0.044*H+0.0 |
0.12 |
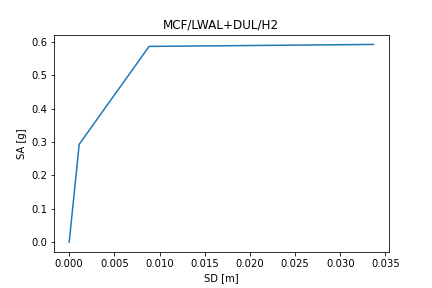
MCF/LWAL+DUL/H2 |
0.2 |
0.8 |
0.044*H+0.0 |
0.25 |
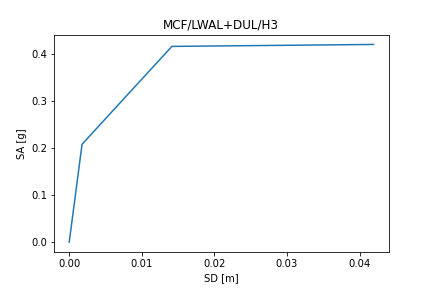
MCF/LWAL+DUL/H3 |
0.2 |
0.8 |
0.044*H+0.0 |
0.37 |
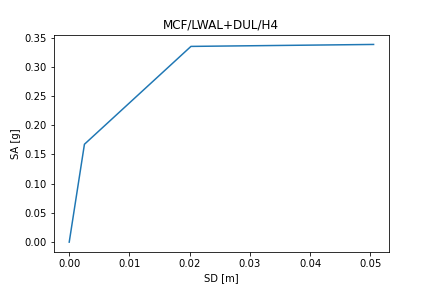
MCF/LWAL+DUL/H4 |
0.2 |
0.8 |
0.044*H+0.0 |
0.49 |
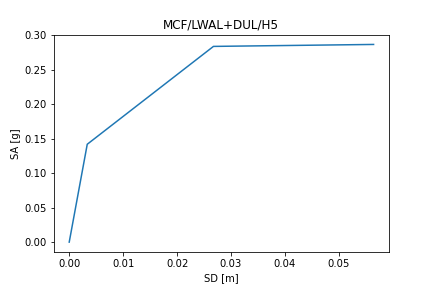
MCF/LWAL+DUL/H5 |
0.2 |
0.8 |
0.044*H+0.0 |
0.62 |
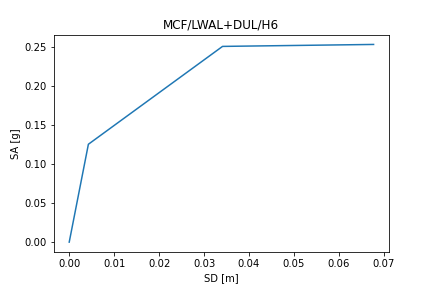
MCF/LWAL+DUL/H6 |
0.2 |
0.8 |
0.044*H+0.0 |
0.74 |
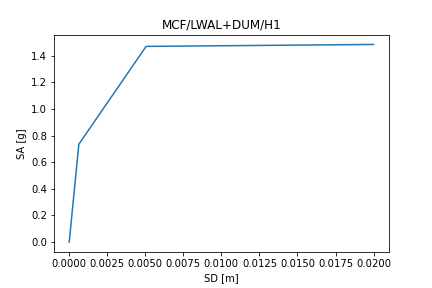
MCF/LWAL+DUM/H1 |
0.24 |
0.95 |
0.042*H+0.0 |
0.12 |
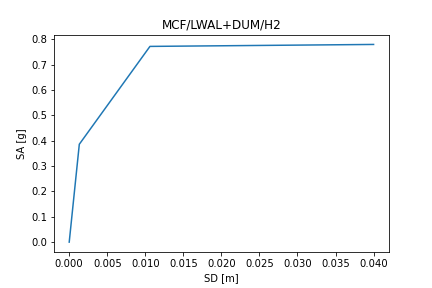
MCF/LWAL+DUM/H2 |
0.24 |
0.95 |
0.042*H+0.0 |
0.24 |
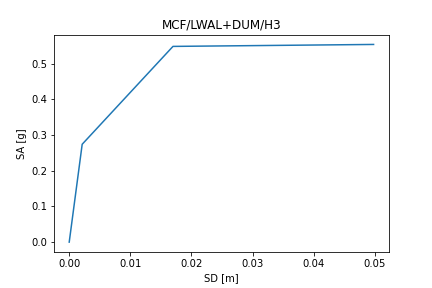
MCF/LWAL+DUM/H3 |
0.24 |
0.95 |
0.042*H+0.0 |
0.35 |
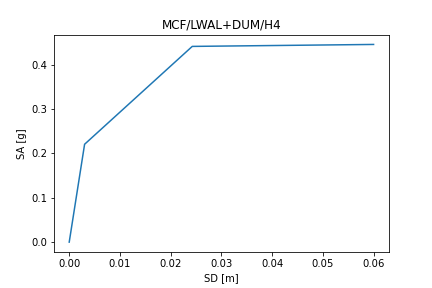
MCF/LWAL+DUM/H4 |
0.24 |
0.95 |
0.042*H+0.0 |
0.47 |
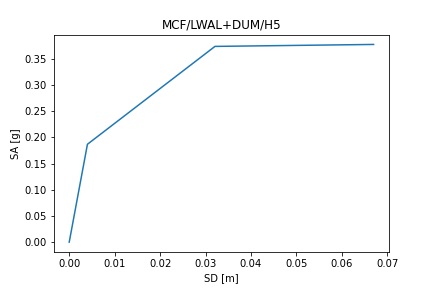
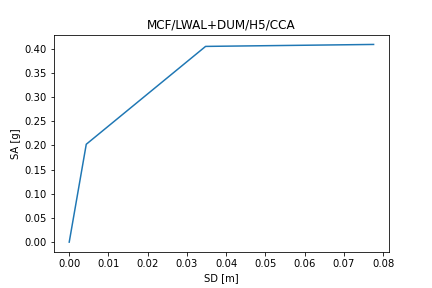
MCF/LWAL+DUM/H5 |
0.24 |
0.95 |
0.042*H+0.0 |
0.59 |
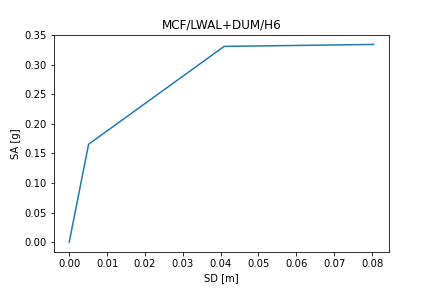
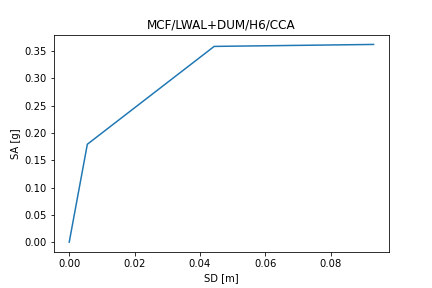
MCF/LWAL+DUM/H6 |
0.24 |
0.95 |
0.042*H+0.0 |
0.71 |
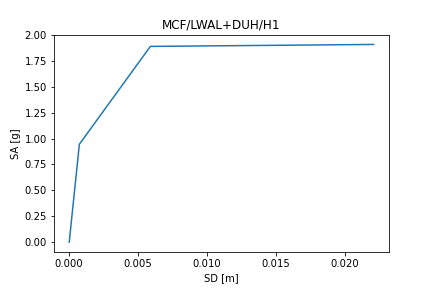
MCF/LWAL+DUH/H1 |
0.28 |
1.05 |
0.04*H+0.0 |
0.11 |
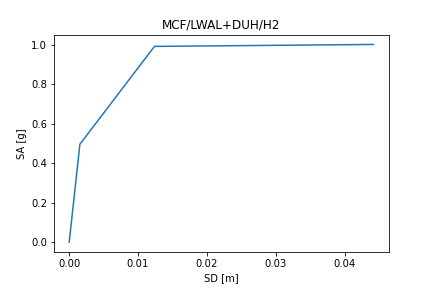
MCF/LWAL+DUH/H2 |
0.28 |
1.05 |
0.04*H+0.0 |
0.22 |
MCF/LWAL+DUH/H3 |
0.28 |
1.05 |
0.04*H+0.0 |
0.34 |
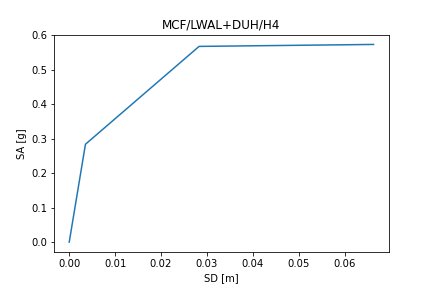
MCF/LWAL+DUH/H4 |
0.28 |
1.05 |
0.04*H+0.0 |
0.45 |
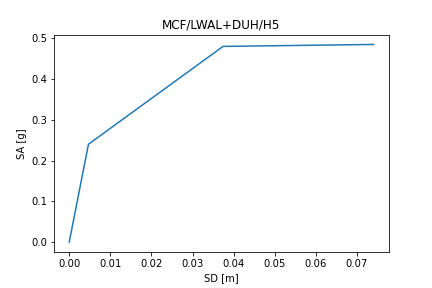
MCF/LWAL+DUH/H5 |
0.28 |
1.05 |
0.04*H+0.0 |
0.56 |
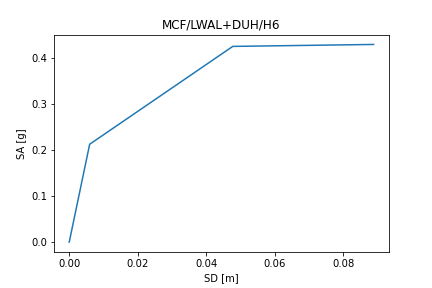
MCF/LWAL+DUH/H6 |
0.28 |
1.05 |
0.04*H+0.0 |
0.67 |
MCF/LWAL+DUL/H1/CCA |
0.22 |
1.04 |
0.044*H+0.0 |
0.12 |
MCF/LWAL+DUL/H2/CCA |
0.22 |
1.04 |
0.044*H+0.0 |
0.25 |
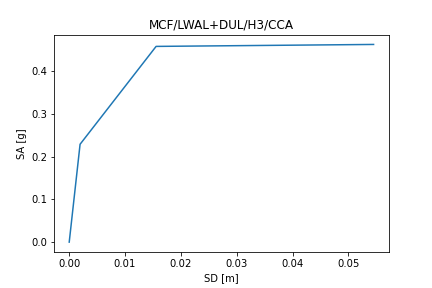
MCF/LWAL+DUL/H3/CCA |
0.22 |
1.04 |
0.044*H+0.0 |
0.37 |
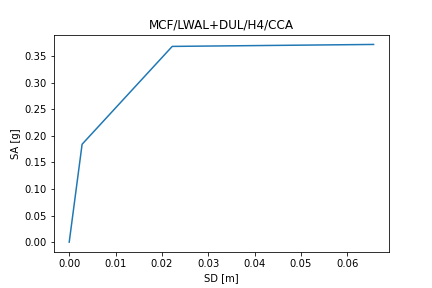
MCF/LWAL+DUL/H4/CCA |
0.22 |
1.04 |
0.044*H+0.0 |
0.49 |
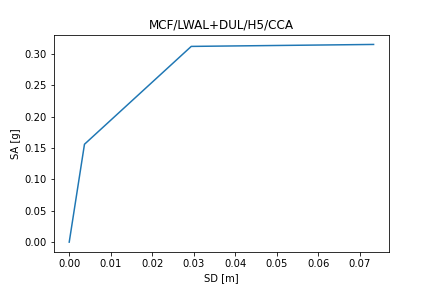
MCF/LWAL+DUL/H5/CCA |
0.22 |
1.04 |
0.044*H+0.0 |
0.62 |
MCF/LWAL+DUL/H6/CCA |
0.22 |
1.04 |
0.044*H+0.0 |
0.74 |
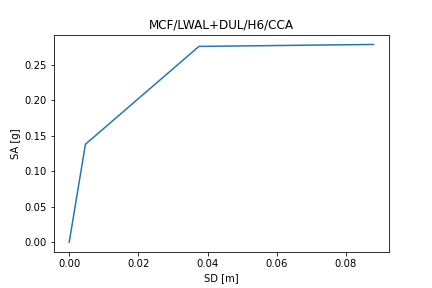
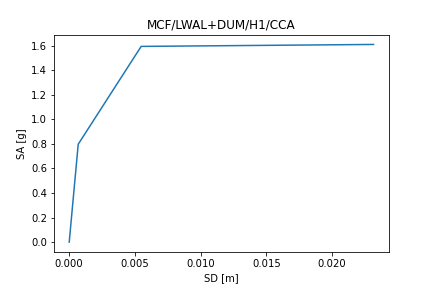
MCF/LWAL+DUM/H1/CCA |
0.26 |
1.1 |
0.042*H+0.0 |
0.12 |
MCF/LWAL+DUM/H2/CCA |
0.26 |
1.1 |
0.042*H+0.0 |
0.24 |
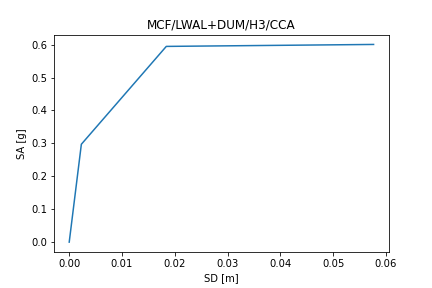
MCF/LWAL+DUM/H3/CCA |
0.26 |
1.1 |
0.042*H+0.0 |
0.35 |
MCF/LWAL+DUM/H4/CCA |
0.26 |
1.1 |
0.042*H+0.0 |
0.47 |
MCF/LWAL+DUM/H5/CCA |
0.26 |
1.1 |
0.042*H+0.0 |
0.59 |
MCF/LWAL+DUM/H6/CCA |
0.26 |
1.1 |
0.042*H+0.0 |
0.71 |
Capacity plots#


References#
A list of references and respective capacity parameters consulted during the definition of GEM’s capacity curves is presented below.
Reference |
URL |
Yield drift [%] |
Ult drift [%] |
Ty=f(H) [s] |
|---|---|---|---|---|
Ahmed et al 2018 |
https://doi.org/10.1155/2018/4756352 |
0.05 |
0.75 |
- |
Gavilan et al 2015 |
https://doi.org/10.1193/090712EQS284M |
0.18 |
0.67 |
- |
Erkoseoglu et al 2014 |
http://www.eaee.org/Media/Default/2ECCES/2ecces_eaee/1156.pdf |
0.77 |
1 |
- |
Magenes and Calvi 1992 |
https://www.iitk.ac.in/nicee/wcee/article/10_vol6_3517.pdf |
0.25 |
0.9 |
- |
Nucera et al 2012 |
https://www.iitk.ac.in/nicee/wcee/article/WCEE2012_4879.pdf |
0.1 |
0.4 |
- |
Villar-Vega et al 2017 |
https://doi.org/10.1193/010716EQS005M |
0.32-0.36 |
0.8-1.2 |
0.042*H |