Ground-Motion Records
Introduction
The nonlinear time-history analyses in this analytical framework employ a comprehensive set of 700 ground-motion records selected from multiple international strong-motion databases. These records span a wide range of seismological characteristics to ensure robust representation of ground shaking variability across different tectonic environments as illustrated in the figures below.
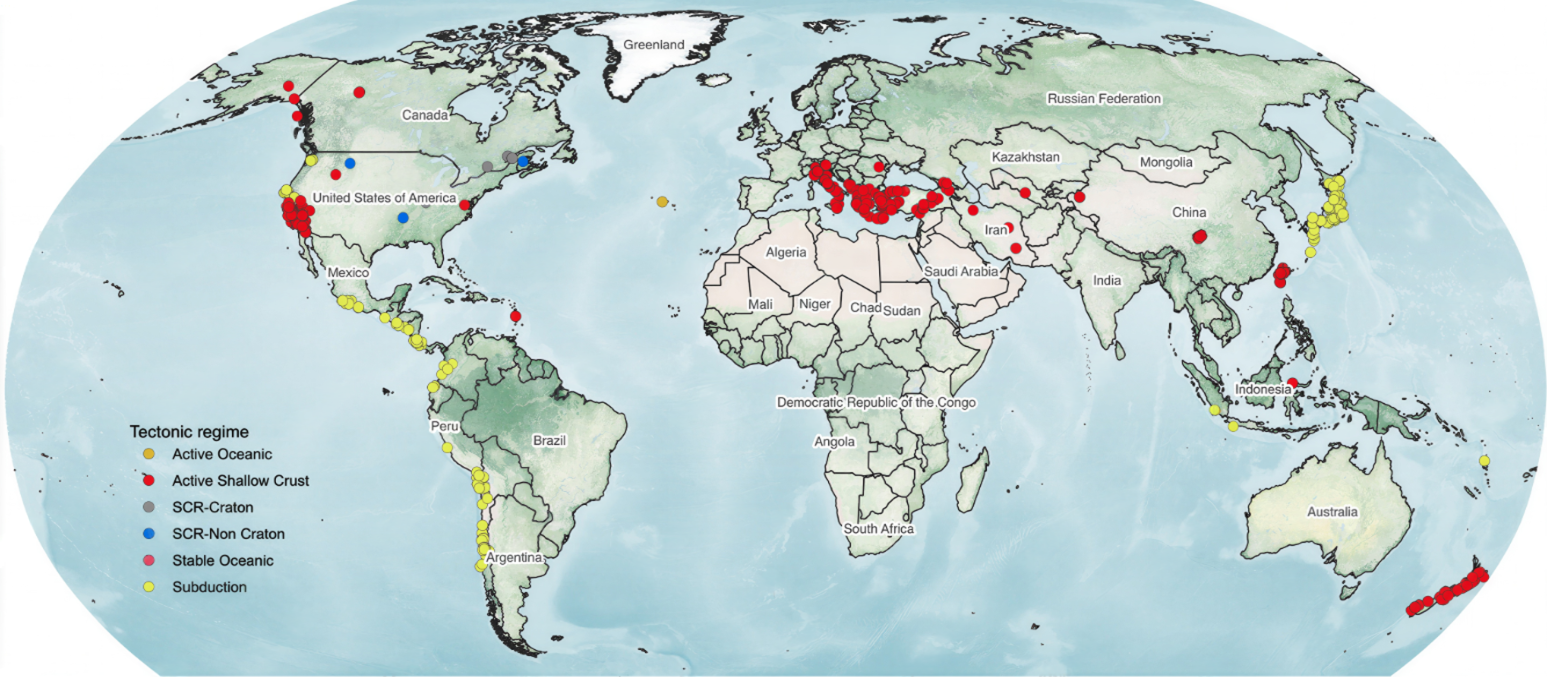
Geographical distribution of selected ground-motion records per tectonic region type.
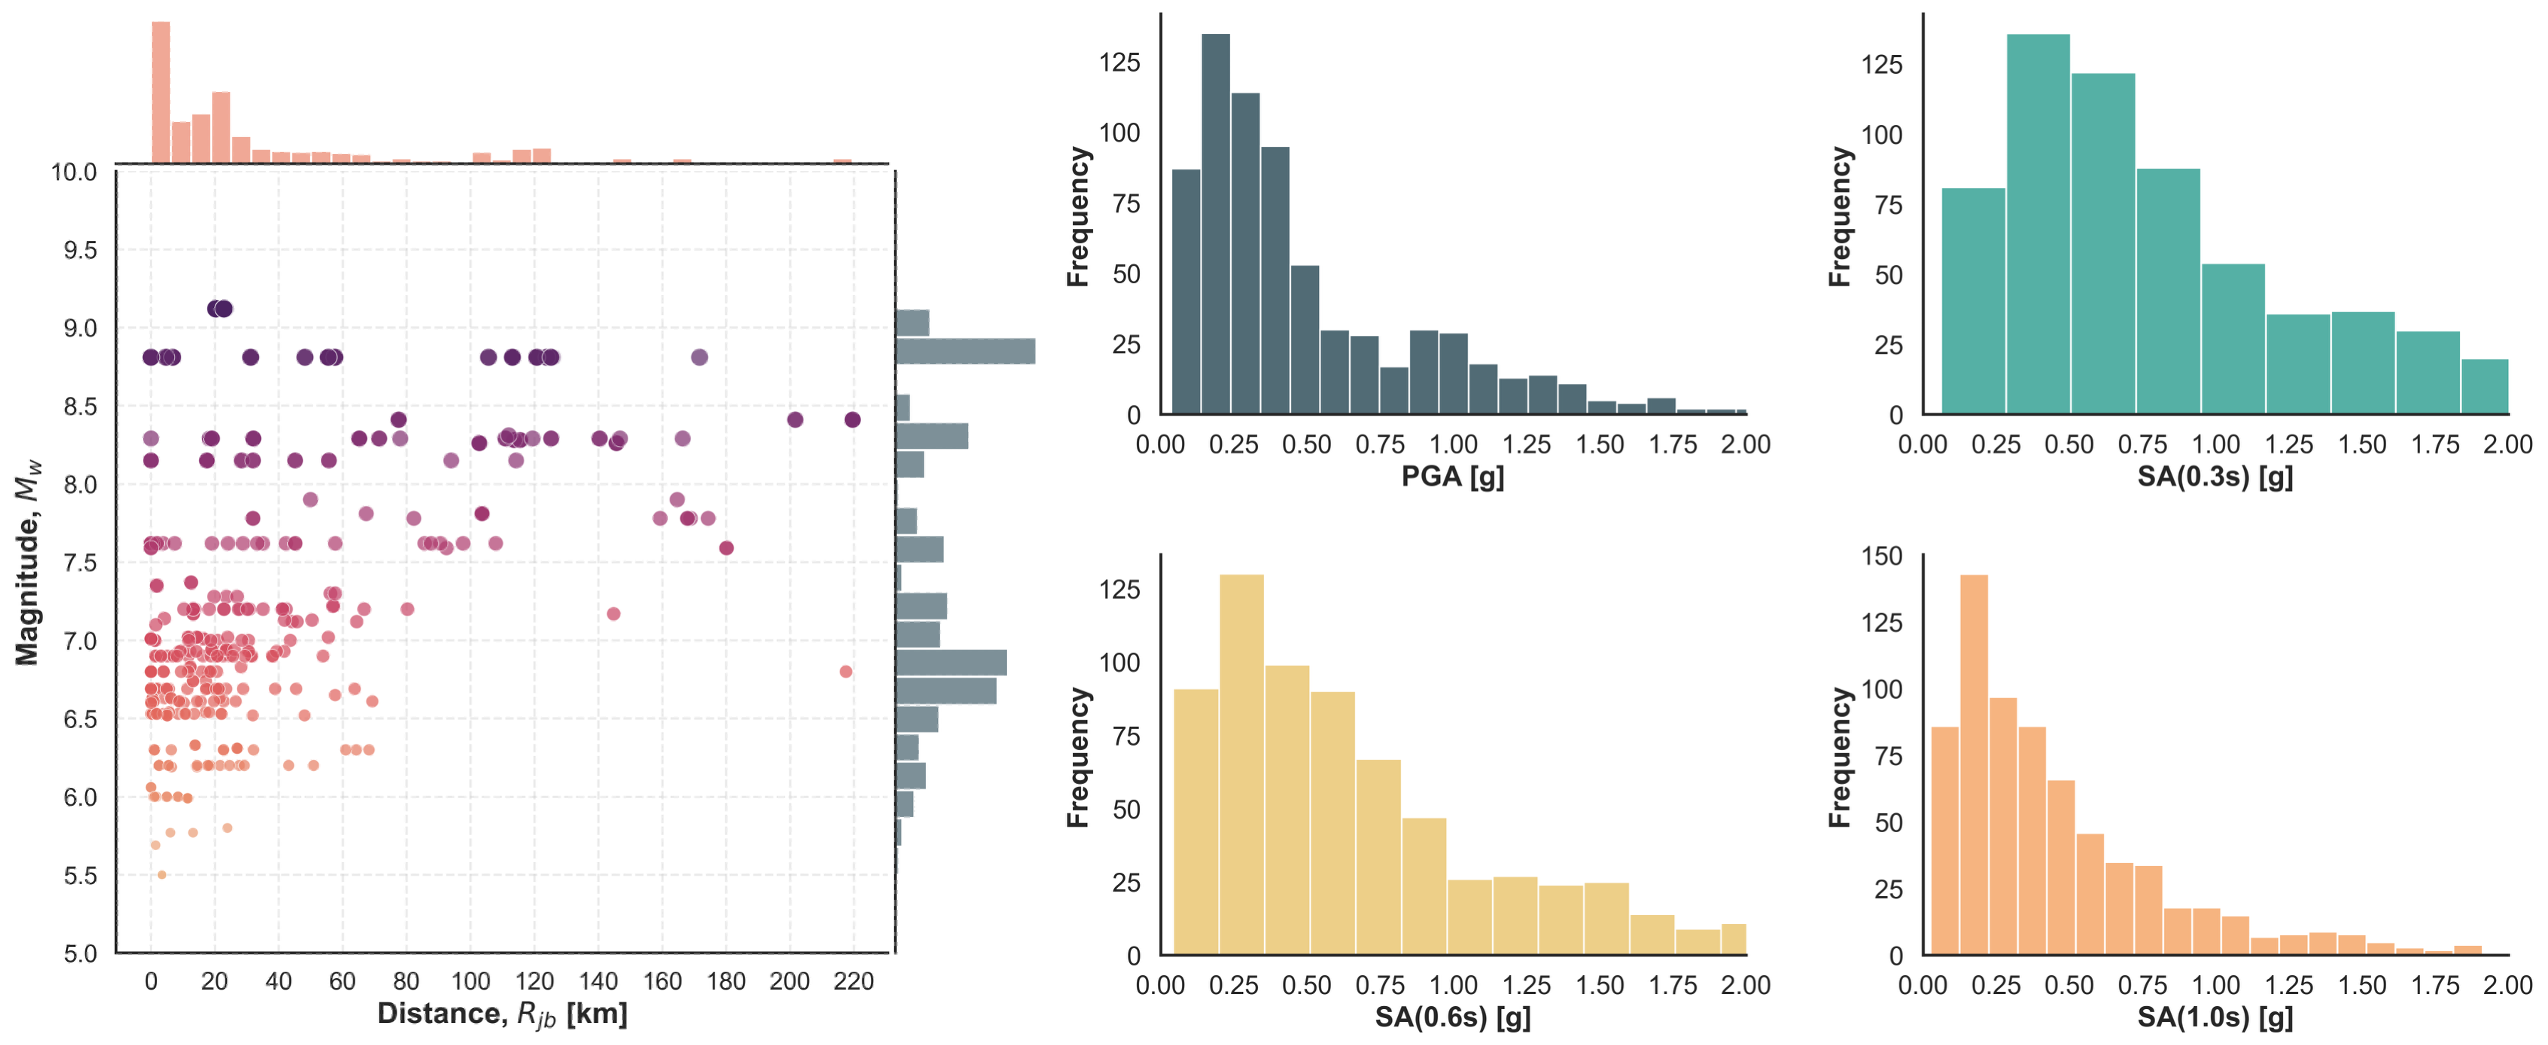
Distribution of magnitude (Mw)–Joyner–Boore distance (Rjb) pairs for the selected ground-motion records and the frequency distribution of the considered IM types.
Database Sources
Records were compiled from five major strong-motion databases:
Database |
Description |
|---|---|
NGA-West2 |
PEER Next Generation Attenuation database for active shallow crustal regions |
NGA-East |
PEER database for stable continental regions (Eastern North America) |
NGA-Sub |
PEER database for subduction zone earthquakes |
KiK-Net |
Japanese strong-motion network (K-NET and KiK-net) |
ESM |
Engineering Strong-Motion database (European/Mediterranean) |
Tectonic Environments
The record set covers three main tectonic environments:
- Active Shallow Crust
Earthquakes occurring at depths less than 35 km in tectonically active regions (e.g., Western North America, Mediterranean, Japan).
- Stable Continental Regions
Intraplate earthquakes in stable continental interiors with typically lower attenuation rates (e.g., Eastern North America, Northern Europe).
- Subduction Zones
Both interface and intraslab earthquakes from subduction environments (e.g., Cascadia, Japan, South America).
Record Selection Criteria
Records were selected following these criteria:
Magnitude range: Mw 4.5 to 9.0
Distance range: Rjb 0 to 300 km (Joyner-Boore distance)
Minimum PGA: 0.05g threshold to exclude weak motions
Scaling limit: Maximum scaling factor of 2.0 to preserve spectral shape
Site conditions: Vs30 ranging from 180 to 1500 m/s
Uniform distribution: Records distributed across IM bins to avoid clustering
Intensity Measures
Multiple intensity measures (IMs) are computed for each record:
IM |
Description |
|---|---|
PGA |
Peak Ground Acceleration [g] |
PGV |
Peak Ground Velocity [m/s] |
PGD |
Peak Ground Displacement [m] |
SA(0.3s) |
Spectral Acceleration at T=0.3s [g] |
SA(0.6s) |
Spectral Acceleration at T=0.6s [g] |
SA(1.0s) |
Spectral Acceleration at T=1.0s [g] |
AvgSA |
Geometric mean of SA over period range [g] |
D5-95 |
Significant duration (5% to 95% Arias intensity) [s] |
Ground-Motion Record Summary
The table below displays the properties of all 700 ground-motion records used in the analysis.
Loading ground-motion summary...
Record Visualization
Select a ground-motion record to view its acceleration time-history and response spectrum.
References
Ancheta T.D. et al. (2014). NGA-West2 Database. Earthquake Spectra.
Goulet C.A. et al. (2021). NGA-East Ground-Motion Models for the U.S. Geological Survey National Seismic Hazard Maps. Earthquake Spectra.
Parker G.A. et al. (2020). NGA-Subduction Global Ground-Motion Models with Regional Adjustment Factors. Earthquake Spectra.
Luzi L. et al. (2020). Engineering Strong Motion Database (ESM). European facilities for earthquake hazard and risk.
Aoi S. et al. (2020). MOWLAS: NIED observation network for earthquake seismology and engineering. Earth, Planets and Space.