Vulnerability methodology#
General description#
The 2018 Global Risk Model followed a methodology thoroughly described in Martins and Silva (2020). In summary, the methodology used an analytical approach based on nonlinear time-history analyses on equivalent single-degree-of-freedom (SDOF) oscillators. It assumes that a single vulnerability function per building class is capable of simulating the losses due to structural components, non-structural components and contents. To account for the fact that nonstructural components start accumulating damage earlier than the structure, the damage model is adjusted to allow damage before the yielding point of the structure. This assumption is illustrated below, where the first damage state (DS1 = Slight Damage) is defined for 75% of the yielding displacement.
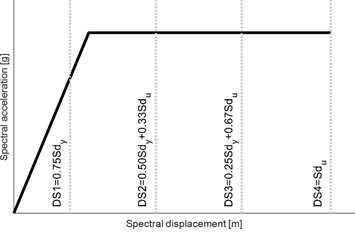
Figure. 1 Damage state thresholds (adapted from Martins and Silva (2020)).
Whilst such a method is reasonable and arguably the most common approach in academia (i.e. a single vulnerability function per building class to perform earthquake loss assessment), it raises some challenges when there is a need to estimate losses for the structural, non-structural components and contents separately. The vulnerability methodology proposed by GEM focuses first on the estimation of the vulnerability for the various components separately (i.e. structural, non-structural and contents). Then, the “total” vulnerability functions (or vulnerability for the buildings - structural + nonstructural) are estimated simply based on the weighted sum of the loss ratios, considering the expected economic value of the three components per line of business.
The following sections describe how the vulnerability functions are derived per type of component, considering the specific structural characteristics of each building class, cause of damage/loss (i.e., deformation versus acceleration) and expected value of the elements.
Definition of equivalent SDOF#
The structural behaviour of each building class is defined though its backbone capacity curve. These curves were constructed based on the yielding (Sdy) and ultimate (Sdult) displacements and the elastic (T1) and yielding (Ty) periods. For the building classes where no significant reduction in the base shear capacity due to damage accumulation was expected (e.g. steel frames, timber and composite structures) the capacity was assumed to follow a trilinear elasto-plastic model (see Figure 2-top). Building classes for which a significant reduction in the base shear capacity is expected due to the accumulation of damage in masonry panels (e.g. confined masonry or reinforced concrete with infills were modelled assuming a quadrilinear capacity curve (see Figure 2 - bottom). Building classes with this type of backbone curve follow a similar approach to compute the first two points, with the end of the elastic range being defined at 0.5Say and T1 and the peak being computed from the yield displacement and Ty. The third point of the capacity curve coincides with the yield displacement of the equivalent bare frame class. Finally, the last capacity point is simply taken from the ultimate displacement.
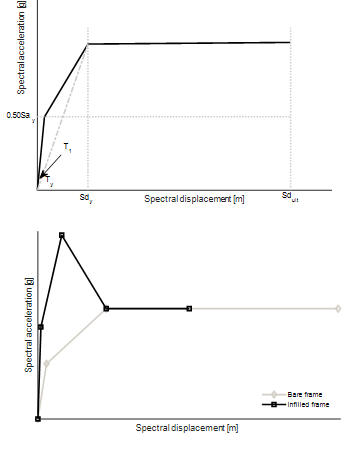
Figure 2. Types of backbone curves
Vulnerability of structural elements#
Damage in these components is assumed to be drift sensitive, and its initiation is defined by the yielding point. Before this point, the building is assumed to deform elastically, and thus with no significant damage. Thus, the damage criterion shown in Table 1 (defined as a function of the yielding and ultimate displacements) can be used for the structural components.
Table 1. Damage criteria for structural elements
Damage state |
Damage threshold |
|---|---|
Slight |
Sd_y |
Moderate |
0.67Sd_y+0.33Sd_u |
Extensive |
0.33Sd_y+0.67Sd_u |
Complete |
Sd_u |
The fragility functions are then derived following the methodology defined in Martins and Silva (2020) using the vulnerability modellers toolkit (Martins and Silva 2021). We have assumed damage ratios equal to 0.05, 0.20, 0.60 and 1.00 for Slight, Moderate, Extensive and Complete damage, respectively.
Vulnerability of nonstructural elements#
The damage in these components is assumed to be both due to drift (i.e. deformation) and accelerations. According to the HAZUS manual, the breakdown between drift-sensitive and acceleration-sensitive depends strongly on the type of occupancy. For example, non-structural components in residential buildings are mostly drift-sensitive, while in industrial buildings the opposite is true - i.e., most components are acceleration-sensitive). This means that it will be necessary to develop occupancy-dependent fragility functions. The breakdown below in Table 2 is proposed for such functions:
Table 2. Assumed replacement value for drift-sensitive and acceleration-sensitive nonstructural components
Occupancy |
Drift-sensitive value (DV) |
Acceleration-sensitive value (AV) |
|---|---|---|
Residential |
75% |
25% |
Commercial |
40% |
60% |
Industrial |
20% |
80% |
This distribution of value between drift-sensitive and acceleration-sensitive is not purely based on HAZUS, given that the construction in the United States tends to have a stronger contribution from acceleration-sensitive components (i.e. hanging ceilings, lightning).
The damage criteria have to be defined for both the drift-sensitive engineering demand parameter (Sd) and acceleration-sensitive engineering demand parameter (Sa). Given that non-structural components tend to sustain damage before structural components do (e.g. infill walls have a low deformation capacity), we propose an initiation of damage before reaching the yielding displacement of the structure, as described in the table below. Once again the damage thresholds were defined as a functions of the yielding and ultimate displacements. We have assumed damage ratios equal to 0.05, 0.20, 0.60 and 1.00 for Slight, Moderate, Extensive and Complete damage, respectively, as shown below in Table 3.
Table 3. Damage criteria for drift-sensitive nonstructural elements
Damage State |
Drift-sensitive damage thresholds |
|---|---|
Slight |
0.75Sd_y |
Moderate |
0.50Sd_y+0.33Sd_u |
Extensive |
0.25Sd_y+0.67Sd_u |
Complete |
Sd_u |
For the non-structural components that are acceleration-sensitive, we performed a review of the types of components typically found in residential, commercial and industrial facilities using the FEMA P-58 document and several other peer reviewed publications (e.g. Porter et al (2010), Porter et al (2014), Cremen and Baker (2019) and Rashid et al (2021)). This source of fragility functions has several models for components such as regular objects, shelves, computer equipment, workstations and machinery. We also distinguished between components in buildings with no seismic provisions and buildings constructed according to more modern regulations. It is also worth mentioning that for this type of components, the majority of the literature recommends assuming only two damage states (i.e. undamaged or damaged). This assumption is due to the fact that these components (electronics, furniture, machinery) are unlikely to be classified in different damage states or to even be repaired. Instead, most likely they will be fully replaced. Following these assumptions, the acceleration thresholds shown in Table 4 were considered for the three lines of business.
Table 4. Damage criteria for acceleration-sensitive nonstructural elements
Occupancy |
Non ductile or low ductility |
Moderate or high ductility |
|---|---|---|
Residential |
0.70g |
1.20g |
Commercial |
0.80g |
1.20g |
Industrial |
0.80g |
1.50g |
It should be noted that accelerations transmitted to the components are limited to the maximum shear capacity of the building. After yielding is reached it can be observed that the accelerations of the SDOF do not increase with increasing intensity (see example in Figure 3). Therefore, in order to properly assess the fragility of the acceleration sensitive components it was necessary to revise the cloud analysis methodology described in Martins and Silva (2020) to accommodate a bilinear regression as suggested by O’Reilly and Calvi (2021). An exception to this behaviour are the one storey buildings where due to the fact some components are placed directly on the ground the accelerations they experience are the accelerations of the ground.
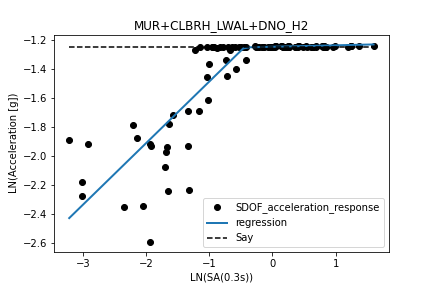
Figure 3. Example of SDOF response and bilinear regression
We make an assumption that damage states of structural components and contents are statistically independent, i.e., if contents are placed outside the building, collapse of the building will not affect the damage state of the contents. This implies that there is no correlation between ground motions, which cause structural collapse, and ground motions which affect the damage state of the contents. This seems rational, since the structure is usually responsive to different characteristics of ground motions (i.e., deformation) than contents (i.e., acceleration). We account for the fact that complete structural damage of the building causes complete damage of the contents through the total probability theorem in the following manner:
Where DV and AV stand for the economic value of the drift-sensitive and acceleration-sensitive components, respectively, E[LR|IM]{drift} stands for the loss ratio computed from the drift-sensitive fragility functions, E[LR|IM]{acc} stands for the loss ratio computed from the acceleration-sensitive fragility functions, and P[DS4] stands for the probability of having complete damage. In other words, for the acceleration-sensitive component, if the building suffers complete damage, we assume that the acceleration-sensitive components will be also lost.
Vulnerability of contents#
The damage suffered by the contents is assumed to be acceleration-sensitive, and consequently the same damage criterion presented previously for the acceleration-sensitive non-structural components are considered (see Table 4). As previously mentioned, due to the limited base shear capacity of some building classes, it is possible that a given building will never experience levels of acceleration capable of causing significant damage in the contents. For example, the maximum base shear capacity of a 4-storey low ductile reinforced concrete with masonry infills (when expressed in terms of Sa) is less than 0.5g. This means that the contents of this building class will never reach extensive or complete damage due to high levels of acceleration, despite the fact that the building might actually structurally collapse for much lower levels of acceleration. It is thus necessary, once again, to incorporate the probability of complete structural damage in the estimation of the loss ratios for this type of element, as expressed by the following formula:
Single vulnerability functions for all components#
For the sake of simplicity, or simply due to the lack of detail in the exposure model, it might be necessary to perform the loss assessment considering a single vulnerability function. In this case, it is necessary to carefully combine the previously described vulnerability functions (i.e. structural, non-structural components and contents). We propose to perform this combination considering the value of the different components. This distribution of value highly depends on the type of occupancy. According to a review of several existing documents and publications, the distributions shown below in Table 5 have been proposed per occupancy.
Table 5. Assumed replacement value breakdown by component
Occupancy |
Structural components value (SV) |
Non-structural components value (NSV) |
Contents value (CV) |
|---|---|---|---|
Residential |
0.30 |
0.50 |
0.20 |
Commercial |
0.20 |
0.30 |
0.50 |
Industrial |
0.15 |
0.25 |
0.60 |
It is important to mention that this distribution varies regionally, with well-developed countries with a stronger contribution of contents to the total replacement cost of the buildings, while poorer nations tend to have a higher structural value.
The expected loss ratio for the vulnerability functions (considering all components) is given by the following expression:
Fragility due to out-of-plane failure of masonry panels#
Past event damage surveys (e.g. 6th April 2009 L’Aquila earthquake) have highlighted the need to properly account for the effect of out-of-plane failure of masonry panels.
To account for these effects, the out-of-plane capacity of masonry classes was estimated following the recommendations by Doherty et al (2002) and Sumerente et al (2020). The point of out-of-plane instability is evaluated by solving the rocking mechanism illustrated in Figure 4 where the weight of the panel (Mg) provides the stabilising force, the lateral force (F0) is the destabilising load and the position of pivot point depends on the thickness of the panel (t). As depicted in Figure 4 the position of the lateral force depends on the boundary conditions which are a function of the number of storeys of the building.
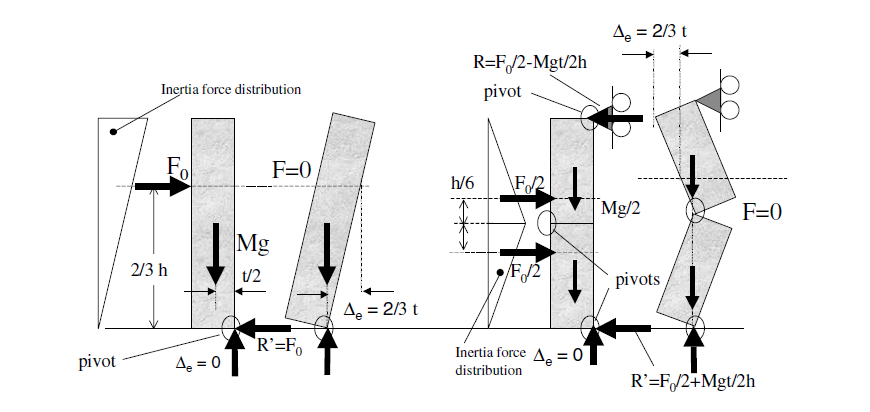
Figure 4. (Left) Parapet wall at point of instability (Right) Simply-supported wall at point of instability (from Doherty et al (2002))
The out-of-plane capacity can be simplified by a trilinear model (see Figure 5) where ultimate displacement capacity (Δf) is assumed to be 2/3t, and Δ1 and Δ2 are a function of the ultimate displacement capacity and the state of degradation of the joints (see Table 6).
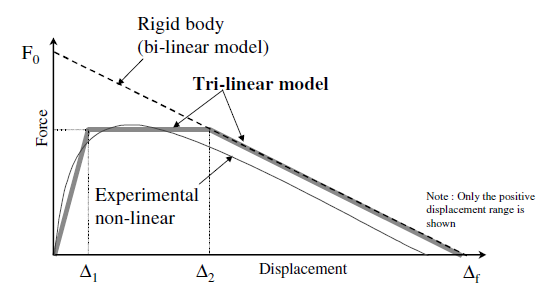
Figure 5. Simplified trilinear out-of-plane capacity (from Doherty et al (2002))
Table 6. Empirically derived displacement relationships (from Doherty et al (2002))
State of degradation of the joints |
Δ1/Δf |
Δ2/Δf |
|---|---|---|
New |
0.06 |
0.28 |
Moderate |
0.13 |
0.40 |
Severe |
0.20 |
0.50 |
Having evaluated the out-of-plane capacity (see example in Figure 6 - left), the process of computing the vulnerability for out-of-plane uses the same approach with nonlinear dynamic analysis on equivalent single degree of freedom oscillators and cloud analysis. The main difference for the in-plane analysis is the consideration of a single damage state (i.e. complete out-of-plane failure). The expected loss at each intensity level was computed from the sum of the losses coming from in-plane and out-of-plane failure mechanisms weighted by the probability of collapse (see example of combined functions in Figure 6 - right).
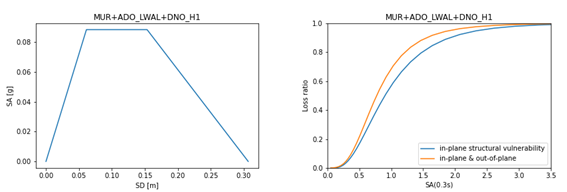
Figure 6: (Left) Example of out-of-plane capacity curve for adobe construction; (Right) Comparison between in-plane vulnerability curve and combination of in-plane and out-of-plane structural vulnerability functions.
References#
Cremen, G. and Baker, J.W. (2019) Improving FEMA P-58 non-structural component fragility functions and loss predictions. Bulletin of Earthquake Engineering, 17(4): p. 1941-1960. DOI: 10.1007/s10518-018-00535-7.
Doherty, K. T., Griffith, M. C., Lam, N., and Wilson, J. (2002). Displacement-based seismic analysis for out-of-plane bending of unreinforced masonry walls. Earthquake Eng. Struct. Dyn. 31, 833–850.
FEMA (2014) HAZUS-MH MR5, Technical Manual, Department of Homeland Security - Federal Emergency Management Agency
Martins, L. and Silva, V. (2020) Development of a fragility and vulnerability model for global seismic risk analyses. Bulletin of Earthquake Engineering. DOI: 10.1007/s10518-020-00885-1.
Martins, L., Silva, V., Crowley, H. and Cavalieri, F. (2021) Vulnerability Modellers Toolkit, An Open-source Platform for Vulnerability Analysis. Bulletin of Earthquake Engineering. DOI: https://doi.org/10.1007/s10518-021-01187-w.
O’Reilly, G.J. and Calvi, G.M. (2021) A seismic risk classification framework for non-structural elements. Bulletin of Earthquake Engineering, 19(13): p. 5471-5494. DOI: 10.1007/s10518-021-01177-y.
Porter K., Farokhnia K., Vamvatsikos D. and Cho I.H. (2014), Guidelines for component-based analytical vulnerability assessment of buildings and nonstructural elements, GEM Technical Report 2014-13 V1.0.0, 102 pp., GEM Foundation, Pavia, Italy, DOI: 10.13117/GEM.VULN-MOD.TR2014.13.
Porter, K., Johnson, G., Sheppard, R. and Bachman, R. (2010) Fragility of Mechanical, Electrical, and Plumbing Equipment. Earthquake Spectra, 26(2): p. 451-472. DOI: 10.1193/1.3363847.
Rashid M, Dhakal R, Sullivan T (2021). Seismic design of acceleration-sensitive non-structural elements in New Zealand: State-of-practice and recommended changes. Bulletin of the New Zealand Society for Earthquake Engineering. 54.
Sumerente, G., Lovon, H., Tarque, N. and Chácara, C. (2020) Assessment of Combined In-Plane and Out-of-Plane Fragility Functions for Adobe Masonry Buildings in the Peruvian Andes. Frontiers in Built Environment, 6. DOI: 10.3389/fbuil.2020.00052.