15. Driving the OpenQuake Engine
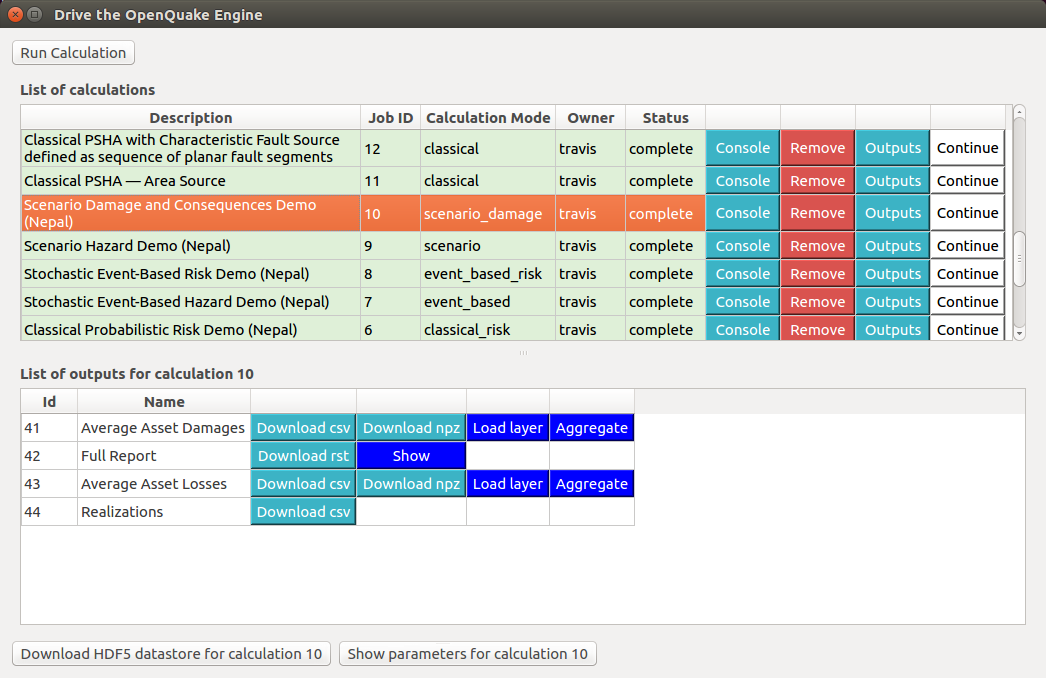
Fig. 15.1  Dialog to run the OpenQuake Engine server
The plugin enables to drive the OpenQuake Engine, submitting new jobs, watching calculation progress, retrieving and visualizing results, seamlessly within the QGIS interface. This is made possible by leveraging the OpenQuake Engine Server HTTP RESTful API. The connection with a running OQ-Engine Server (WebUI) has to be properly set up as described in OpenQuake IRMT settings. The server can run locally in the same computer where QGIS is running, or remotely. For instance, it is possible to connect to a remote cluster, to perform jobs that are highly demanding in terms of computational resources.
15.1. Run a calculation
When the Run Calculation button is pressed, a file explorer is opened, enabling to select the input files needed to run the job (or a zip archive containing them), including the job.ini file. By pressing Open to confirm, the job is submitted. The interface keeps querying the server asynchronously, and displaying the status of the calculation.
15.2. The list of calculations
For each calculation available on the connected OQ-Engine server (only those that the current user is authorized to visualize), the List of calculations (see Dialog to run the OpenQuake Engine server) shows its Description, its unique Job ID, its Calculation Mode, its Owner and its Status (indicating if the calculation is still running, if it failed or if it was successfully completed). The list is refreshed at regular intervals of few seconds and it displays the most recent 100 calculations.
Note
Before OpenQuake Engine 2.6, the Job Type was displayed instead of the Calculation Mode, specifying only if a calculation was classified as hazard or risk. If the plugin attempts to connect to an outdated OpenQuake Engine Server that is older than version 2.6, the column Calculation Mode will display the value unknown for all calculations. In case it happens, we recommend to update the OQ Engine Server or to downgrade the plugin to an earlier version, in order to ensure maximum compatibility between the two software versions.
It is possible to scroll the list up and down and to resize it with respect to the List of outputs. When any row of the list of calculations is selected, the row is highlighted and the list of outputs for the corresponding calculation is populated (it will be an empty list if the calculation has not been successfully completed). While a row is selected, it is automatically centered in the visible area of the list, at each refresh. By clicking again on the currently selected row, it will be unhighlighted, resetting the default scrolling behavior of the table.
15.3. Watch the console log
It is possible to watch the log of a calculation, by pressing the Console button in the corresponding row. The log will be displayed in a separate window as shown in Example of console output for a OQ-Engine calculation.
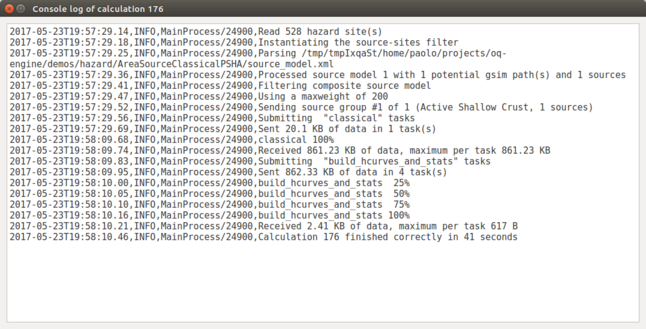
Fig. 15.2 Example of console output for a OQ-Engine calculation
15.4. Download outputs
If a calculation was completed successfully, an Outputs button is provided. When it is clicked, the list of available outputs is shown, which depends on the type of artifacts generated by the calculation. Outputs can be downloaded in one of the available formats, by clicking the corresponding button. In some cases, they can also be loaded as QGIS layers (whenever a corresponding Load layer button is available), and a default styling is applied, based on parameters chosen by the user. In some cases (e.g., damage by asset), while loading the layer, it is also possible to aggregate points by zone. In order to do so, it is necessary to specify another available layer, with polygons geospatially containing the points to be collected. The aggregation is performed leveraging an algorithm provided by the QGIS processing toolbox, called “Join attributes by location (summary)”.
Warning
The layers that are automatically imported from OQ-Engine outputs are stored in memory, unless they are explicitly saved by the user into a persistent format, such as a shapefile. Please be aware that the contents of in memory layers will not be saved when the QGIS project that contains them is saved. Furthermore, saving an in memory layer into a persistent file, only the contents of the layer will be saved, and not its style. If you want to save also the style, you have to right-click on the original layer and select Styles -> Copy Style, and then do the same on the target persistent layer and select Styles -> Paste Style.
A hazard map defines the geographic distribution of the values of a scalar IMT (see also Definitions and acronyms) characterized by a fixed probability of being exceeded at least once in a time span T. For computing a hazard map with the OpenQuake-engine the user defines an IMT, a region over which the map will be computed and, the corresponding probability of exceedance. An alternative representation of a hazard map fixes the value of IMT and computes over an area the corresponding probability of at least on exceedance in T; this typology of result is currently not supported by the OpenQuake-engine.
A loss map provides the estimated losses for a collection of assets, for a certain return period (or probability of exceedance within a given interval of time). It is important to understand that these maps are not providing the distribution of losses for a seismic event or level of ground motion with the chosen return period, nor can the losses shown on the map be summed to obtain the corresponding aggregate loss with the same return period. This type of maps is simply providing the expected loss for a specified frequency of occurrence (or return period), for each asset.
Note
All layers created loading data from OQ-Engine outputs contain metadata that can be visualized within the “Layer Properties” panel. The “Title” of the calculation can be found in the “Identification” tab. Dozens of other parameters that are specific for each calculation type are stored in the “Keywords” tab.
Other kinds of outputs (e.g. hazard curves and uniform hazard spectra) can be visualized in the OpenQuake IRMT Data Viewer (see The OpenQuake IRMT Data Viewer).
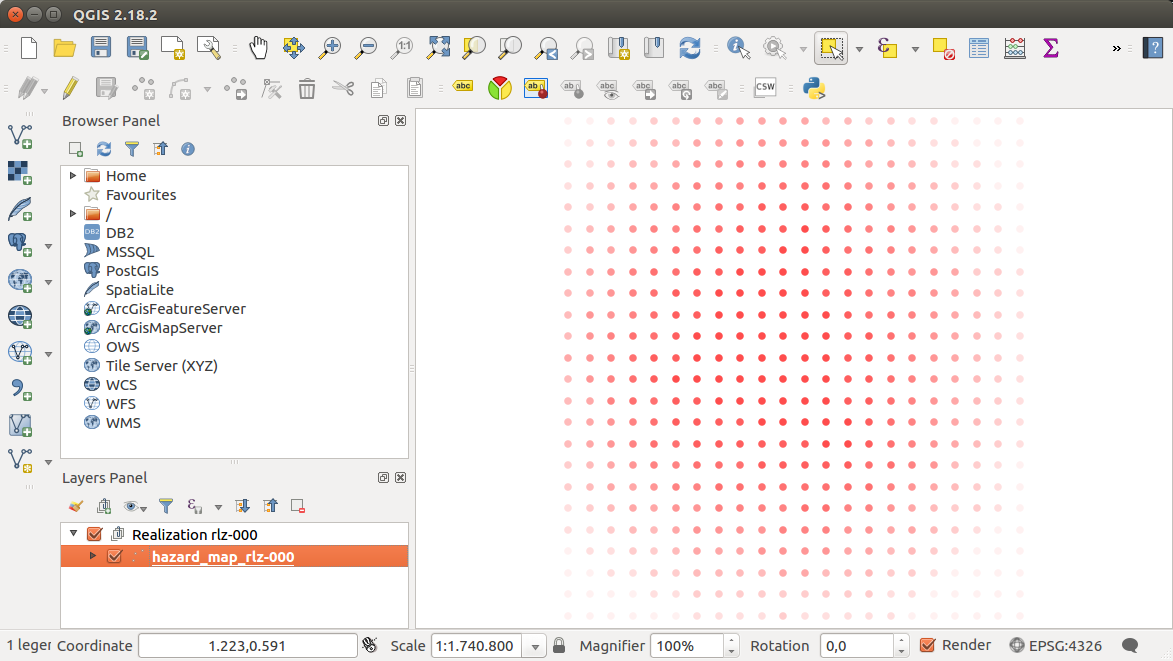
Fig. 15.3 Example of a hazard map produced by the OpenQuake Engine
It is also possible to download the HDF5 datastore corresponding to a chosen calculation. When the Outputs button is pressed, the Download HDF5 datastore for calculation N button is enabled (where N is the calculation ID). By pressing it and selecting a destination folder, the file is downloaded and its full path is displayed both in the QGIS message bar and in the Log Messages Panel.
Another button that becomes available when a calculation identified as N is selected is Show parameters of calculation N. It opens a dialog window with a text area displaying the parameters of the calculation (see Example showing parameters of a OQ-Engine calculation).
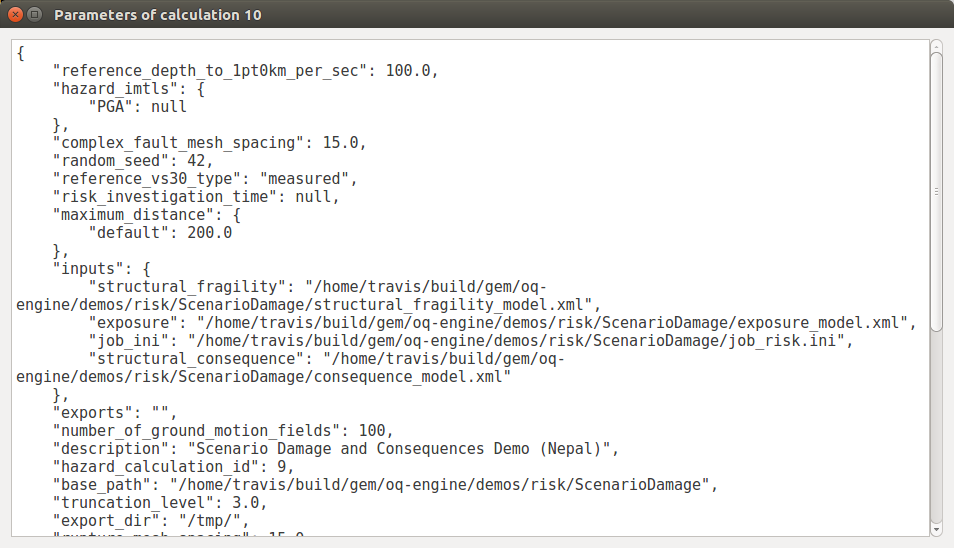
Fig. 15.4 Example showing parameters of a OQ-Engine calculation
15.5. Run a postprocessing (or risk) calculation on top of a previously computed hazard
To run a postprocessing or risk calculation on top of a previous hazard one you have to click the Continue button on the corresponding hazard calculation and select the files including the postprocessing or risk job.ini and the related inputs (or a zip archive containing them).
15.6. Remove a calculation
To remove a calculation, press the Remove button. It will remove the calculation from the list, from the database and from the datastore.
15.7. Abort a calculation
To abort a calculation while it is still running, press the Abort button. The aborted calculation will still be visible in the list, and it will be possible to visualize the corresponding console log. Afterwards, it will be possible to completely remove the calculation from the list, from the database and from the datastore, by pressing the button Remove.
15.8. Calculation status
The Status column of the List of calculations indicates the current status of a calculation, which can be one of the following: created, executing, complete, failed.
The reason behind a failed calculation can be inspected by watching the console log, by means of the Console button.