11. Aggregating loss by zone
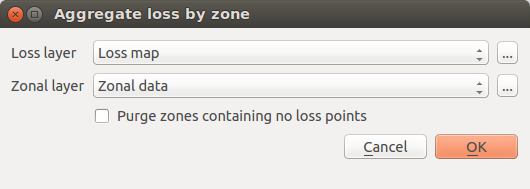
Fig. 11.1  Aggregate loss by zone data import tool
The development of an integrated risk model (IRI) arises from the convolution of two main components: 1) estimations of physical risk (RI), and 2) a social vulnerability index (SVI). The convolution of earthquake physical risk and social vulnerability parameters can be accomplished by, first, importing risk assessments from OpenQuake (or some other source) using the risk import tool (Fig. 11.1). To import data, users can click the Aggregate loss by zone button that prompts a dialog window to open. Here, it is possible to select layers containing estimations of physical risk, (Loss layer) or some other type of risk model, and to combine these with a layer containing zonal geometries of the study area (e.g., country borders, district borders) and socioeconomic indicators. The top dropdown menu is pre-populated with the names of the available vector layers containing point geometries (a native output of the OQ-Engine), while the second dropdown menu is pre-populated with the names of the available vector layers containing polygonal geometries. If those menus do not contain the desired layers, it is possible to click one of the ... buttons, to load another layer from the file system. As soon as a new layer is loaded, it will be available in the QGIS table of contents and its name will become available and pre-selected in the corresponding dropdown menu.
Estimations of physical risk can be made available from the OQ-Engine as one or multiple CSV files. By selecting the file type Loss curves from the OpenQuake-engine, such files become available and can be (multi)selected. The resulting loss layer will contain a number of attributes equal to the number of CSV files imported, and each attribute will correspond to a different loss type.
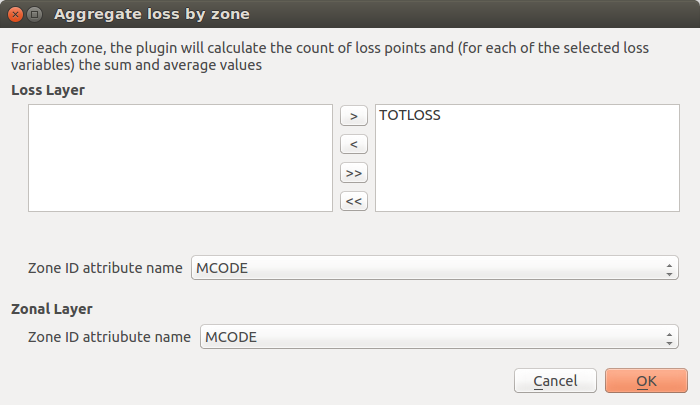
Fig. 11.2 Zonal aggregation of loss values
Loss data from the OQ-Engine is rendered as points containing X,Y locational coordinates and the loss values for the different assets represented at a given location. Once both a loss layer and a zonal layer have been selected, the above dialog window is opened (Fig. 11.2). In the Loss Layer section of the dialog window, the user is invited to select one or more attributes from the loss layer. This selection is because the toolkit will calculate the sum and average values for each of the zonal layer features, and it will add those statistics to the zonal layer as new attributes. Within the layer attribute table, a subsequent attribute will be added to display the count of loss points that are found inside the boundaries of each feature. The latter can be useful for troubleshooting.
The aggregation by zone can be obtained in different ways. If the user is aware that both the loss layer and the zonal layer contain a common attribute that indicates the id of the zone to which each feature belongs, then it is sufficient to select this common attribute both for the loss layer and the zonal layer, and let the tool perform a simple join. In this case, the aggregation is fast because it does not require spatial analysis.
If a common zonal ID does not exist, a spatial join using zonal geometries may be utilized. This is accomplished, first, by selecting Use zonal geometries within the Zone ID attribute name dropdown menu that contains also the names of all the attributes of the loss layer. As a consequence, the tool will perform a spatial search to detect to which zone each of the loss points belongs. The Zone ID attribute name in the zonal layer is the attribute that uniquely identifies each of the zones. If the user is not sure if features are uniquely identified by any of the available attributes in the zonal layer, then it is possible to select the additional item Add field with unique zone id. As a consequence of this choice, the tool will produce an additional attribute in the corresponding layer, and it will set the values of that attribute to be equal to the unique id of the corresponding feature. Then the new attribute will be used as unique id of the feature, to perform the loss aggregation by zone.
As a subsequent step, earthquake risk data imported into the tool should be standardized to render the data commensurate to the socioeconomic indicators created within the tool.