8. Transforming attributes
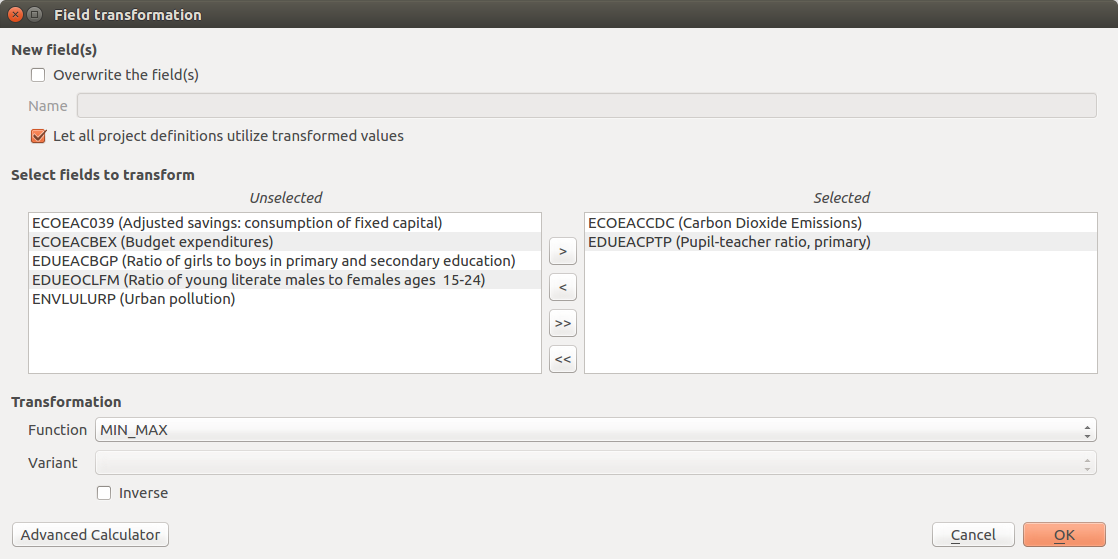
Fig. 8.1  Variable transformation and batch transformation functionality
When variables are defined in incommensurate ranges or scales, they can be standardized to avoid problems inherent when mixing measurement units, and normalization is employed to avoid having extreme values dominate an indicator, and to partially correct for data quality problems. The QGIS platform natively provides a Field calculator that can be used to update existing fields, or to create new ones, in order to perform a wide variety of mathematical operations for the standardization/transformation of data. In addition, the IRMT provides a number of transformation functions found in popular statistical and mathematical modelling packages (Table 8.1).
| Standardization (or Z-scores) |  |
| Min-Max | 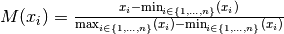 |
| Logistig Sigmoid | 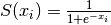 |
| Simple Quadratic | 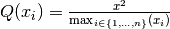 |
Warning
Not all layer types can be edited. For instance, it is impossible to add or modify fields of a csv-based layer. Prior to apply transformations to non-editable layers, it is necessary to save them as shapefiles or as another editable kind.
These include:
- Data Ranking is the simplest standardization technique. Ranking is not affected by outliers and allows the performance of enumeration units to be benchmarked over time in terms of their relative positions (rankings).
- Z-scores (or normalization) is the most common standardization technique. A Z-score converts indicators to a common scale with a mean of zero and standard deviation of one. Indicators with outliers that are extreme values may have a greater effect on the composite indicator. The latter may not be desirable if the intention is to support compensability where a deficit in one variable can be offset (or compensated) by a surplus in another.
- Min-Max Transformation is a type of transformation that rescales variables into an identical range between 0 and 1. Extreme values/or outliers could distort the transformed risk indicator. However, the MIN-MAX transformation can widen a range of indicators lying within a small interval, increasing the effect of the variable on the composite indicator more than the Z-scores.
- Log10 is one of a class of logarithmic transformations that
include natural log, log2, log3, log4, etc. Within the current plugin, we
offer functionality for log10 only, yet these transformations are possible
within the advanced field calculator. A logarithm of any negative number
or zero is undefined. It is not possible to log transform values within the
plugin if the data contains negative values or a zero. For values of zero,
the tool will warn users and suggest that a
 constant be added to move
the minimum value of the distribution.
constant be added to move
the minimum value of the distribution. - Sigmoid function is a transformation function having an S
shape (sigmoid curve). A Sigmoid function is used to transform values on
 into numbers on
  . The Sigmoid function is often
utilized because the transformation is relative to a convergence upon an
upper limit as defined by the S-curve. The IRMT utilizes a simple sigmoid
function as well as its inverse. The Inverse of the Sigmoid function is a
logit function which transfers variables on into a new variable on
.
. The Sigmoid function is often
utilized because the transformation is relative to a convergence upon an
upper limit as defined by the S-curve. The IRMT utilizes a simple sigmoid
function as well as its inverse. The Inverse of the Sigmoid function is a
logit function which transfers variables on into a new variable on
. - Quadratic or U-shaped functions are the product of a polynomial equation of degree 2. In a quadratic function, the variable is always squared resulting in a parabola or U-shaped curve. The IRMT offers an increasing or decreasing variant of the quadratic equation for horizontal translations and the respective inverses of the two for vertical translations.
Note
It may be desirable to visualize the results of the application of transformation functions to data. Although not feasible within the plugin at this point, we intend to build data plotting and curve manipulating functionalities into future versions of the toolkit.
The Transform attribute dialog (Fig. 8.1) was designed to be quite straightforward. The user is required to select one or more numeric fields (variables) available in the active layer. For the selection to be completed, the user must move the variables (either one at a time, or in a batch) to the Selected variables window on the right side of the interface. The user must then select the function necessary to transform the selected variables. For some functions, more than one variant is available. For functions that have an implementation of an inverse transformation, the Inverse checkbox will be enabled to allow users to invert the outcome of the transformation.
The New field(s) section contains two checkboxes and a text field. If the first checkbox Overwrite the field(s) is selected, the original values of the transformed fields will be overwritten by the results of the calculations; otherwise, a new field for each transformed variable will be created to store the results. In situations in which a user may desire to transform variables one at a time rather than using a batch transformation process, it is possible for the user to name each respective new field (editing the default one proposed by the tool). Otherwise, the names of the new fields will be automatically assigned using the following convention: if the original attribute is named ORIGINALNA, the name of the transformed attribute becomes _ORIGINALN (prepending “_” and truncating to 10 characters which is the maximum length permitted for field names in shapefiles). If the layer does not have the limitations of a shapefile, the name of the transformed field will not be truncated to 10 characters.
Note
In the lists of fields, both the field name and the field alias are displayed, with the format name (alias). If no alias is specified for the field, the parenthesis will be empty. The plugin automatically assigns to the transformed field the same alias of the original one (if available). Please make sure that the names of the fields to be transformed do not contain parentheses, otherwise the plugin would erroneously interpret them as containers for the alias; therefore the selected name would be incomplete (being taken excluding the parentheses) and it would not be found in the layer.
If the checkbox Let all project definitions utilize transformed values is checked, all the project definitions associated with the active layer will reference the transformed fields instead of the original ones. Otherwise, they will keep the links to the original selected attributes. In most cases it is recommended to keep this checkbox checked. This automatic update of field references simplifies the workflow because it avoids the need to manually remove the original nodes from the weighting and aggregation tree (discussed in detail in Weighting data and calculating indices) in order to add the transformed nodes and to set again the nodes’ weights. In other words, if a project was developed by weighting and aggregating untransformed indicators, this functionality allows for variables used in the project definition to be replaced on-the-fly (and automatically) by transformed variables. This saves the user from having to augment the model manually.
By clicking the Advanced Calculator button, the native QGIS field calculator is opened. Please refer to the code documentation for the detailed description of all the agorithms and variants provided by the IRMT.